Tip: Are you a non-native English speaker? I have just finished creating a
  Web App
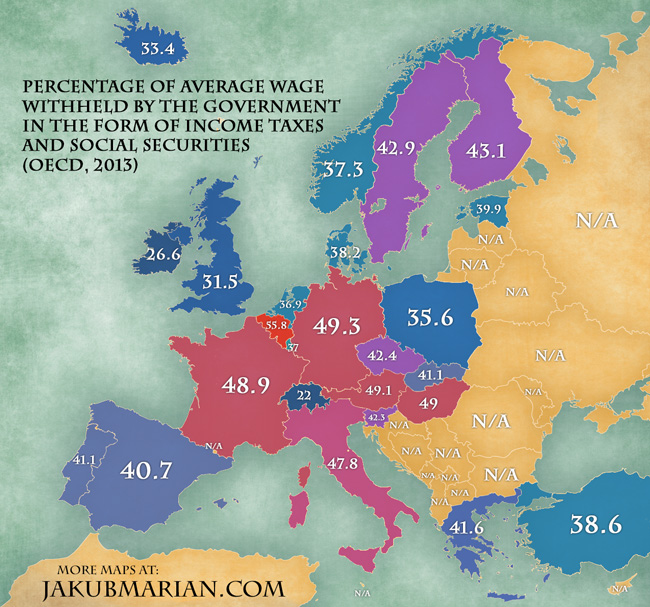
Imagine you are an average-wage worker in your country. Do you know what percentage of the money your employer has to allot to you every month ends up in your government’s treasury?
The following map tells you exactly that. It is based on a study by OECD, which provides up-to-date data on taxation of its members every year (hence only participating OECD members were included).
For example, when a Belgian employer wants to pay a net monthly wage of 1946 EUR (the average wage in Belgium) to an employee, he or she has to be prepared to allot about 4402 EUR to the employee, of which about 2456 EUR, or 55.8% (which is the figure below), ends up in the Belgian treasury.
Do you like the map? Show your support by sharing it.Sharing with attribution helps me create more maps.