Tip: Are you a non-native English speaker? I have just finished creating a
  Web App
In my visualization of the percentage of the EU population able to hold a conversation in English, I presented separate percentages for each EU country (apart from Croatia, because the source of data was from 2012). Then I thought it could be also interesting to determine the percentages for various parts of the EU combined, not just separate countries, so here are some interesting results:
Percentage of English speakers by native language family
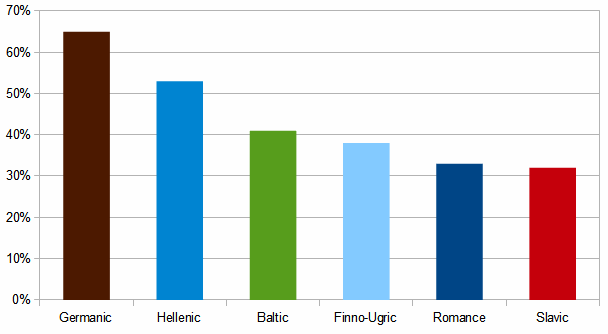
This chart shows the percentage of people able to hold a conversation in English (in the EU) by the language family their mother tongue belongs to. Note that “Germanic” in this chart doesn’t include native speakers of English.
Percentage of English speakers in new member countries
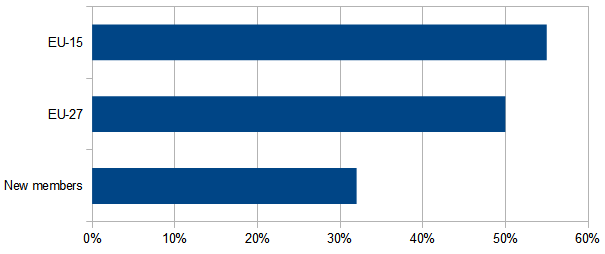
This chart compares the percentages of English speakers in “EU-15” (the 15 member countries that joined the EU before or during 1995), “EU-27” (EU countries that joined before 2013), and “new members” (countries that joined EU after 1995 and before 2013). Note that native English speakers are included in the figures.
Percentage of English speakers by GDP per capita
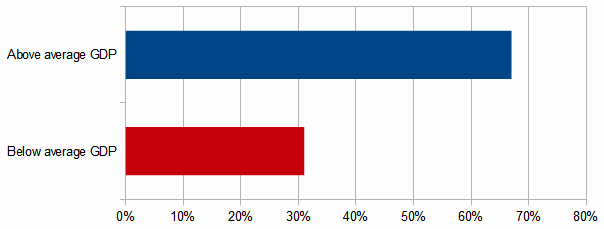
This chart compares the percentages of English speakers of countries whose GDP per capita is above the EU average and the rest. Note that native English speakers are included in this chart.
Raw data
Finally, here’s the table the charts are based on. The study (Special Eurobarometer 386, 2012) only surveyed people aged 15 or older, so the “Population 15+” shows how many people there were in each country aged 15+ in 2012, “% English” shows the percentage of English speakers based on the study, and “# English” shows the number of English speakers in each country (the product of the previous to columns). This last figure is of course not as precise as it may seem from the number of valid digits (this is just to achieve consistency), as the percentage in the third column is based on a small sample of the population and is therefore subject to statistical error.
| Country | Population 15+ | % English | # English |
|---|---|---|---|
| Austria | 7,009,827 | 73% | 5,117,174 |
| Belgium | 8,939,546 | 52% | 4,648,564 |
| Bulgaria | 6,537,510 | 25% | 1,634,378 |
| Cyprus | 660,400 | 73% | 482,092 |
| Czech Republic | 9,012,443 | 27% | 2,433,360 |
| Denmark | 4,561,264 | 86% | 3,922,687 |
| Estonia | 945,733 | 50% | 472,867 |
| Finland | 4,440,004 | 70% | 3,108,003 |
| France | 47,756,439 | 39% | 18,625,011 |
| Germany | 64,409,146 | 56% | 36,069,122 |
| Greece | 8,693,566 | 51% | 4,433,719 |
| Hungary | 8,320,614 | 20% | 1,664,123 |
| Ireland | 3,522,000 | 97% | 3,416,340 |
| Italy | 5,186,2391 | 34% | 17,633,213 |
| Latvia | 1,447,866 | 46% | 666,018 |
| Lithuania | 2,829,740 | 38% | 1,075,301 |
| Luxembourg | 404,907 | 56% | 226,748 |
| Malta | 335,476 | 89% | 298,574 |
| Netherlands | 13,371,980 | 90% | 12,034,782 |
| Poland | 32,413,735 | 34% | 11,020,670 |
| Portugal | 8,080,915 | 27% | 2,181,847 |
| Romania | 18,246,731 | 31% | 5,656,487 |
| Slovakia | 4,549,955 | 26% | 1,182,988 |
| Slovenia | 1,759,701 | 59% | 1,038,224 |
| Spain | 39,127,930 | 22% | 8,608,145 |
| Sweden | 7,791,240 | 86% | 6,700,466 |
| United Kingdom | 51848010 | 97% | 50,292,570 |