Tip: Are you a non-native English speaker? I have just finished creating a
  Web App
Yale University biennially (every even year) publishes the so-called Environmental Performance Index, which measures the state of the environment at the country level. It is based on 24 indicators grouped into 10 categories: air quality, water and sanitation, heavy metals, biodiversity and habitat, forests, fisheries, climate and energy, air pollution, water resources, and agriculture.
The results are based on a wide range of sources, such as remote sensing data, observations from monitoring stations, industry reports, and several others, so they cannot be easily manipulated by governments.
The map below shows the (rounded) EPI of European countries. For comparison, here are some other scores: Japan 75, United States 71, Brazil 61, China 51, India 31.
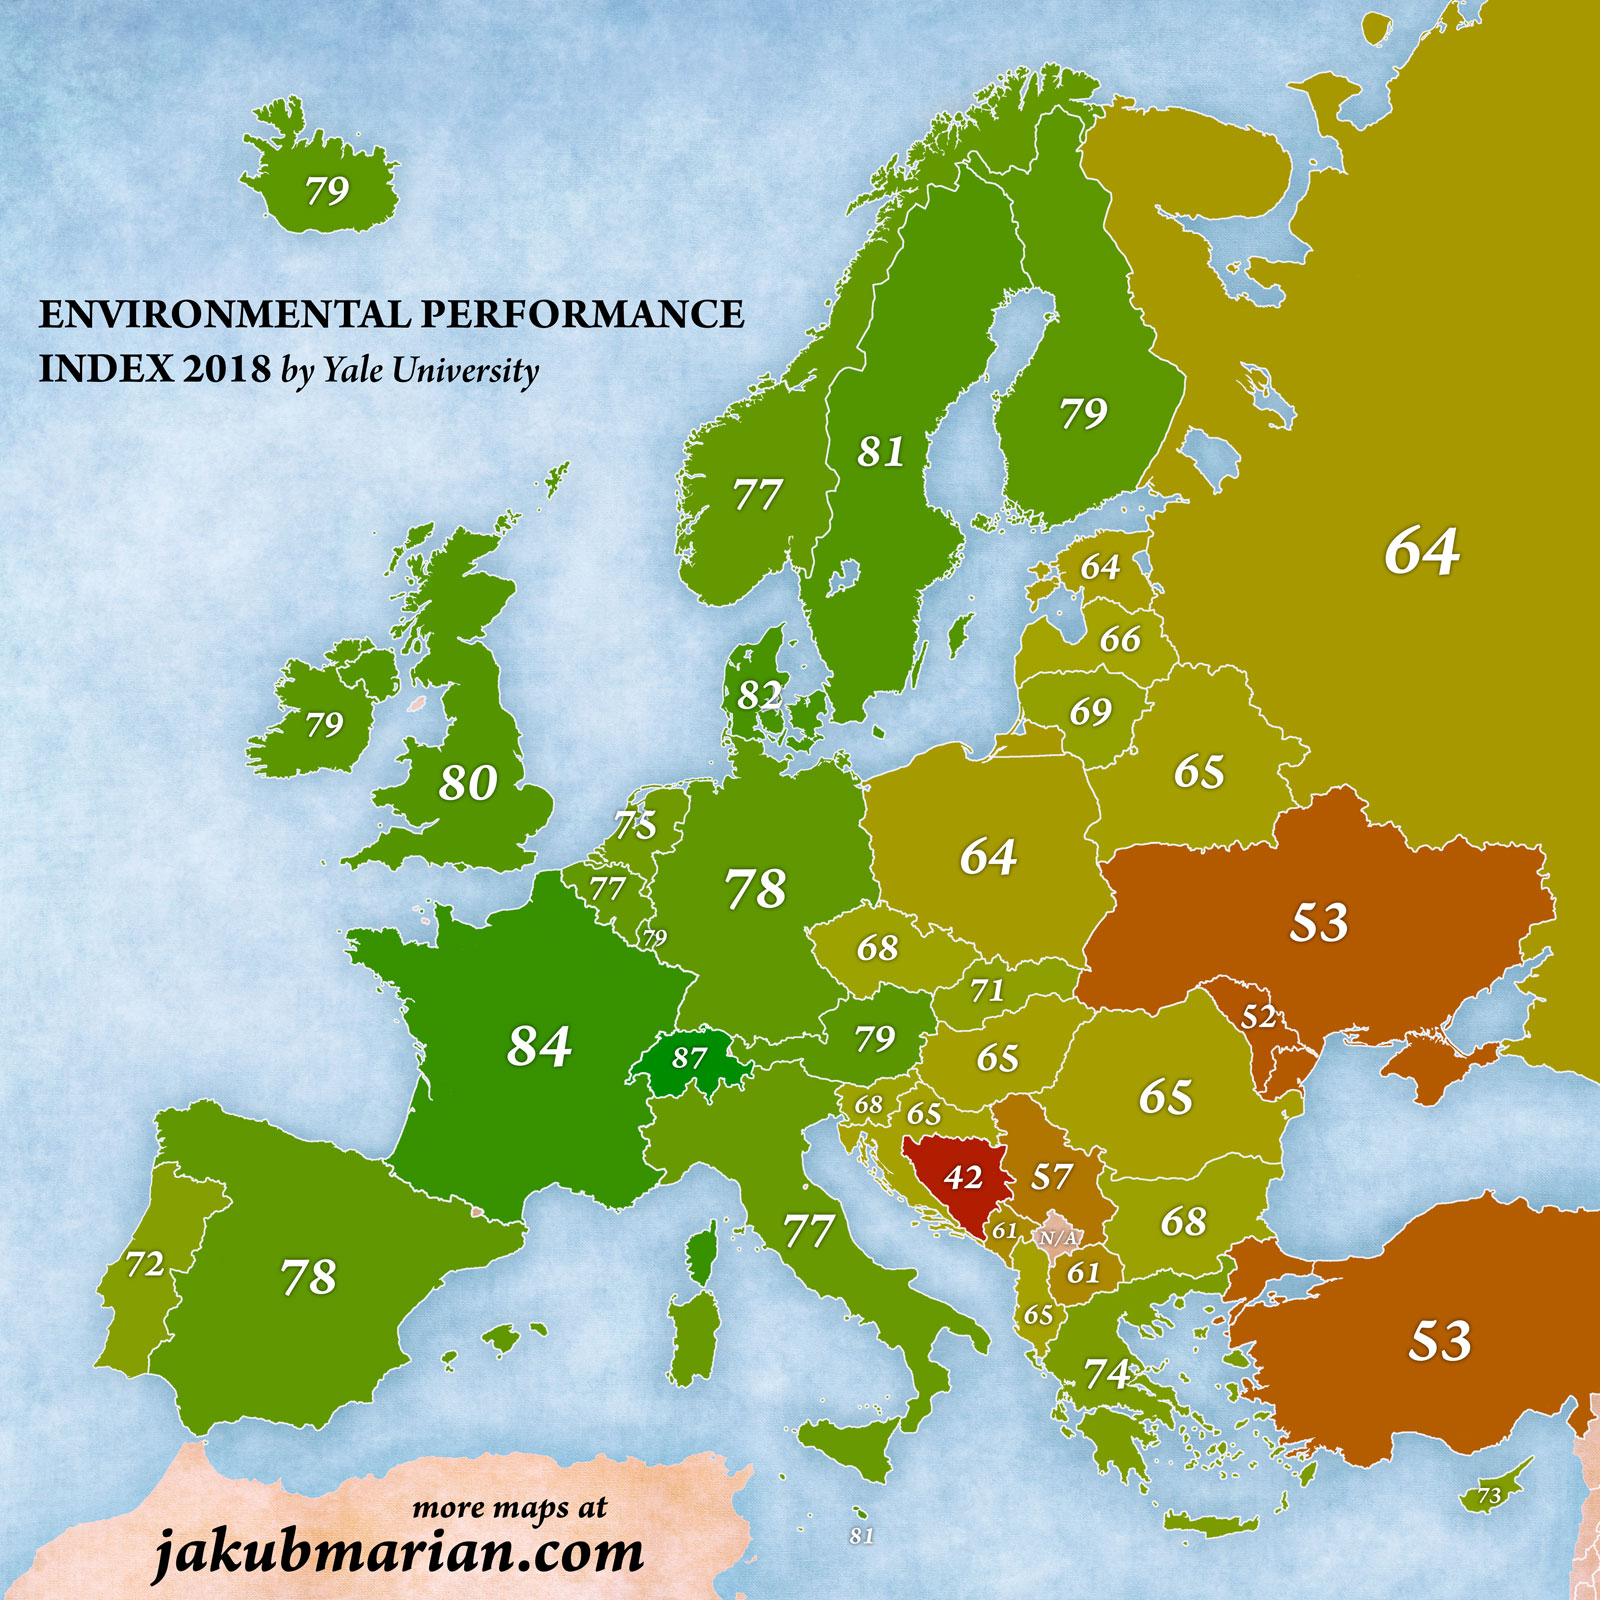
It is worth noting that European countries take the first 16 places in the EPI rankings (the first non-European country on the list is New Zealand with the score of 76). The worst-scoring countries are Burundi (27.4), Bangladesh (29.6) and the Democratic Republic of the Congo (30.4), closely followed by India (30.6).