Tip: Are you a non-native English speaker? I have just finished creating a
  Web App
Gross domestic product, or GDP for short, is perhaps the single most important measure in modern macroeconomics. That is not to say that it is the best indicator of quality of life—people may be happier producing vegetables in a beautiful landscape than earning twice as much but being suffocated by clouds of smog from a nearby factory.
Nevertheless, GDP is an important objective measure of the amount of value produced in a country (and thus of its economic “strength”), and it is important to understand various types of GDP before jumping to conclusions.
I am not going to formally define GDP in this article; it suffices to understand that GDP measures the amount of “monetary” value produced in a country (that is, whenever a product or service is sold, it counts towards GDP). It does not measure non-monetary actions, such as learning new information from a free online resource (like this article) or volunteering to clean the streets.
GDP in Google: A misleading chart
When you ask a non-economist to find the GDP of a country, the odds are he or she will just google “[country name] GDP” (e.g. “Poland GDP”), and the omniscient machine will spit out a chart like the following one:
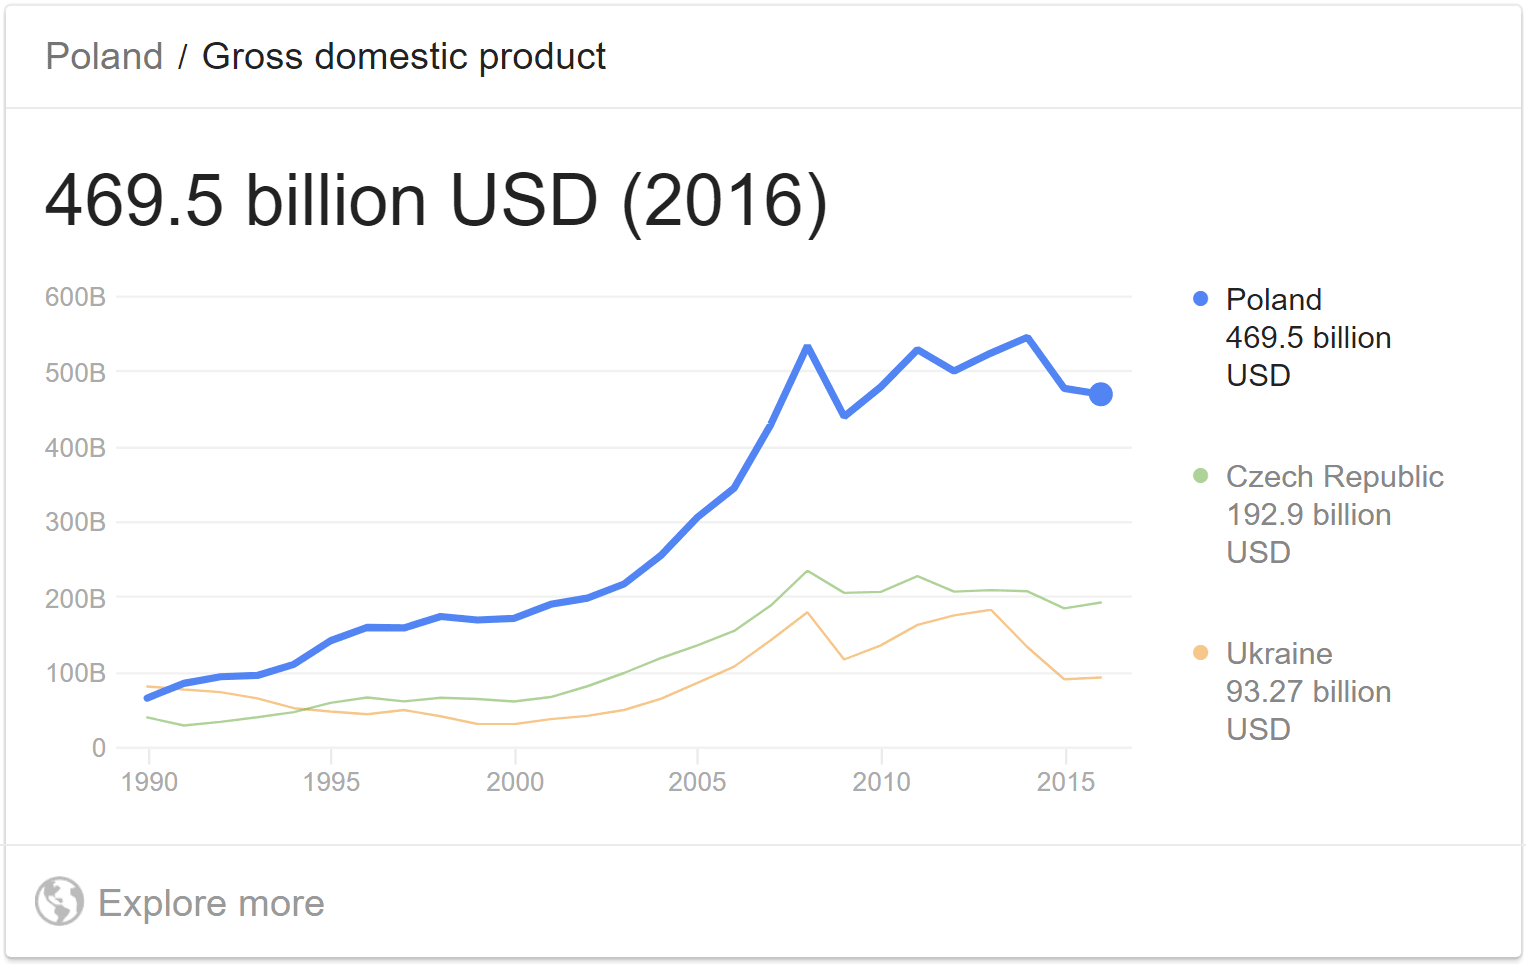
Looking at the chart, you might think, “well, it seems that Poland has been having some problems lately”. However, if you google “Poland GDP growth”, you will get an entirely different picture:
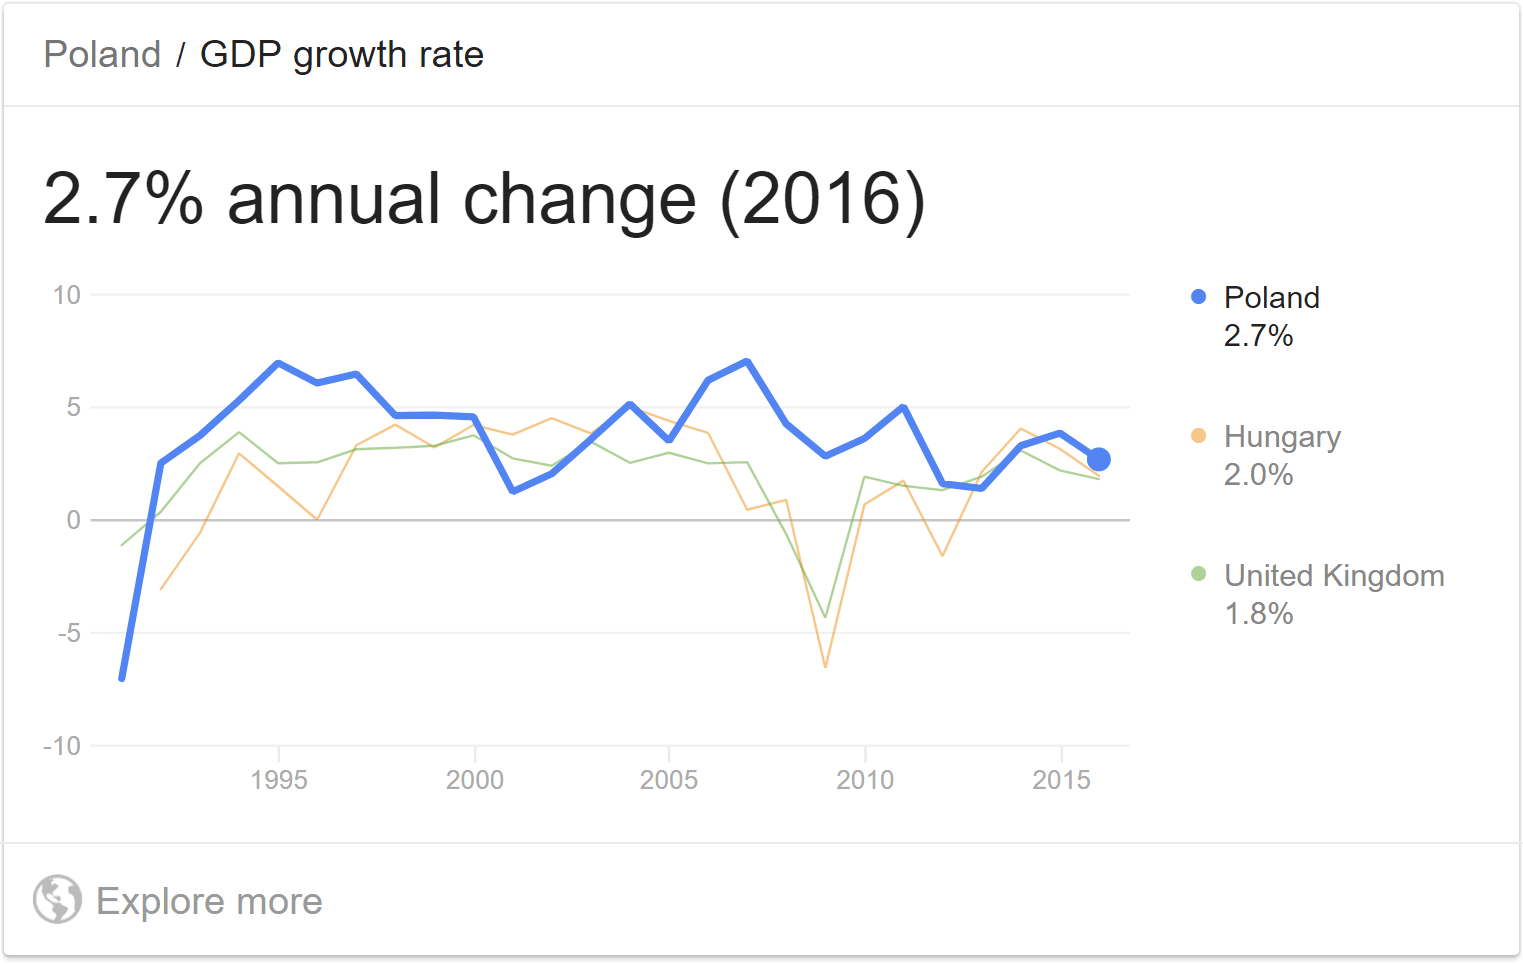
This picture shows that the GDP of Poland has grown every year since 1992, usually by more than 3%. How is that possible?
Nominal GDP (Current US$): The most useless indicator
The problem is that the first picture shows the nominal GDP of Poland, which is usually called GDP (current US$) in databases. It is the GDP in each given year converted to US$ according to the official exchange rate in that year. The US dollar is commonly used as a base because it is the most traded currency in the world, but nominal GDP in any other currency (such as EUR or PLN) would also suffer from the problems described below.
It is important to understand that money is a commodity that changes in value according to supply and demand. When the Fed (the central bank of the US) prints more money, the “price” of the dollar in other currencies goes down (because of more supply). When the US economy grows and demand for the dollar goes up, the price increases. Many other factors influence the value as well.
The GDP of a country in current US$ measures the size of its economy in a unit that changes somewhat arbitrarily from year to year. The figures are suitable for comparison of different countries in a given year (you can see which country has a “bigger” economy), but they are pretty much useless if you want to compare different years.
What about the US?
If you think about it, the GDP of the United States expressed in current US$ also suffers from the problem described above. Although the result is less “volatile” because no currency conversion is involved, it still completely ignores inflation.
To understand what that means, imagine what would happen if the Fed decided to double the amount of money in the economy overnight by simply giving everyone the same amount of money they already have (that is, if you had $1000, they would give you another newly printed $1000) and insisting that every price and remuneration must immediately double.
Of course, this would be impossible to do in practice, but it is essentially what happens gradually over many years with the help of market forces whenever the Fed prints (or otherwise produces) money.
What would happen with the US GDP? There would be no change in everyday life (you would have twice as much money and everything would cost twice as much), but nominal GDP would double (because twice as much money is being spent), leading to a 100% growth rate. Obviously, that’s not a good way to measure economic progress.
Real GDP (Constant US$): The indicator that matters
Before I explain what real GDP is, it is worth noting where you can find the data. Probably the best source is data.worldbank.org. Simply start typing “GDP constant” into the search box and select “GDP (constant 2010 US$)” from the list when it appears (or type “GDP (constant LCU)” for GDP in the local currency). This will show you a graph for the entire world and a list of countries. You can select a country from the list or simply type its name into the search box.
So, what is real GDP? The way it works is that you fix a base year (the World Bank uses 2010 at the moment). Then, whenever you are calculating GDP for another year, you imagine that everything costs the same as in the base year.
In other words, if real GDP grows, it basically means that more products were produced than in the previous year (because “more money was spent while prices stayed constant”). This was the case in Poland for the last 25 years, whose GDP in billions of constant 2010 US$ looks as follows:
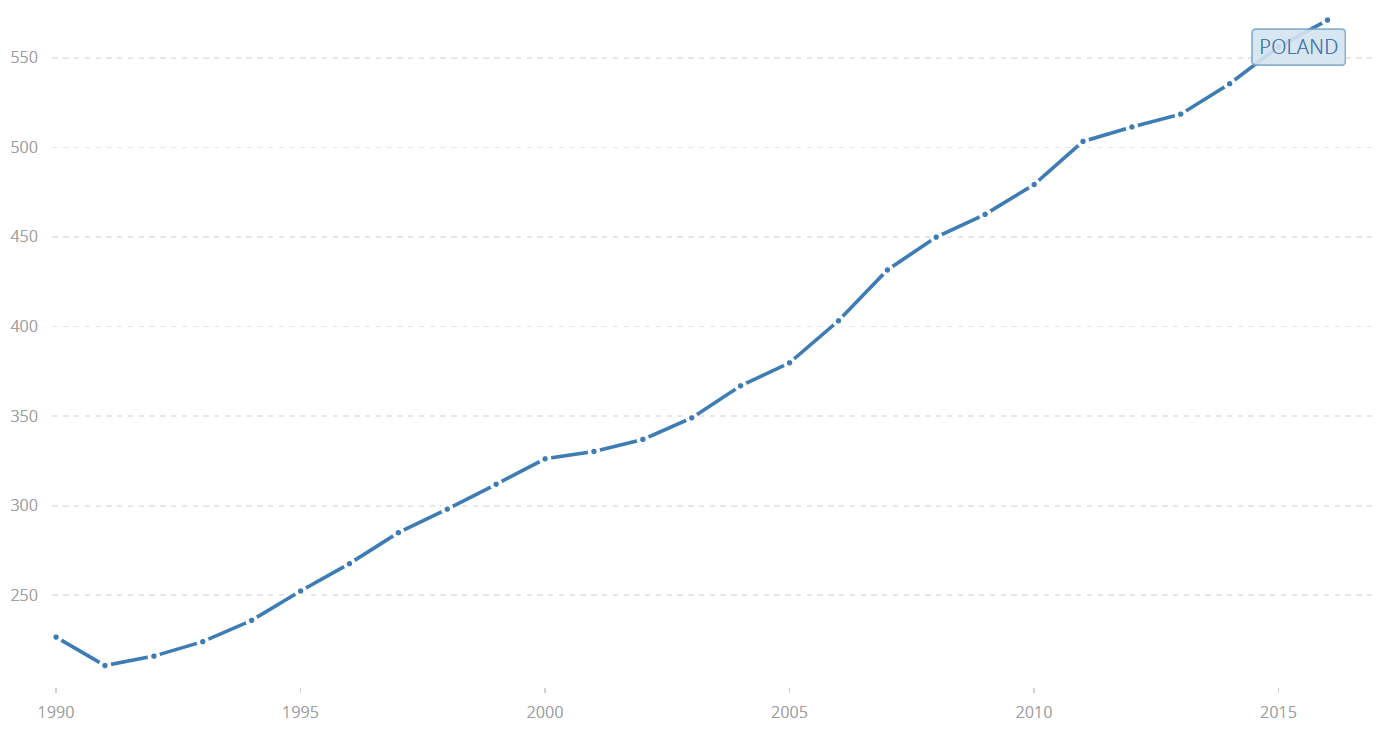
It is, however, worth noting that the further you go from the base year, the less meaningful the figures become because production patterns change (very few people had a mobile phone or Internet access in 1990, for instance).
GDP growth
GDP growth is defined as the difference of this year’s GDP and last year’s GDP in constant currency, as a fraction of last year’s GDP. For example, for 2017 this would be:
$$ \text{2017 GDP growth} = \frac{\text{2017 GDP} - \text{2016 GDP}}{\text{2016 GDP}} \ \text{in constant currency} $$Ideally, this should be in 2016 constant currency (that is, how much was produced in 2017 based on 2016 prices), but in practice, it suffices to peg both values to the same base year that is not too far in the past (such as 2010).
For example, if a country had a real GDP of 1 trillion US$ in 2016 and 1.1 trillion US$ in 2017 (with the same base year), the growth rate is:
$$ \frac{1.1 \text{ trillion} -1 \text{ trillion}}{1 \text{ trillion}} = 0.1 = 10\%. $$Real GDP per capita: The real measure of growth
One drawback of real GDP and GDP growth defined above is that they ignore changes in population. Whenever population grows faster than production, people get poorer on average, even though real GDP may be increasing.
This is not just a theoretical concept. Take a look at the following graph of real GDP of Oman (in billions constant 2010 US$):
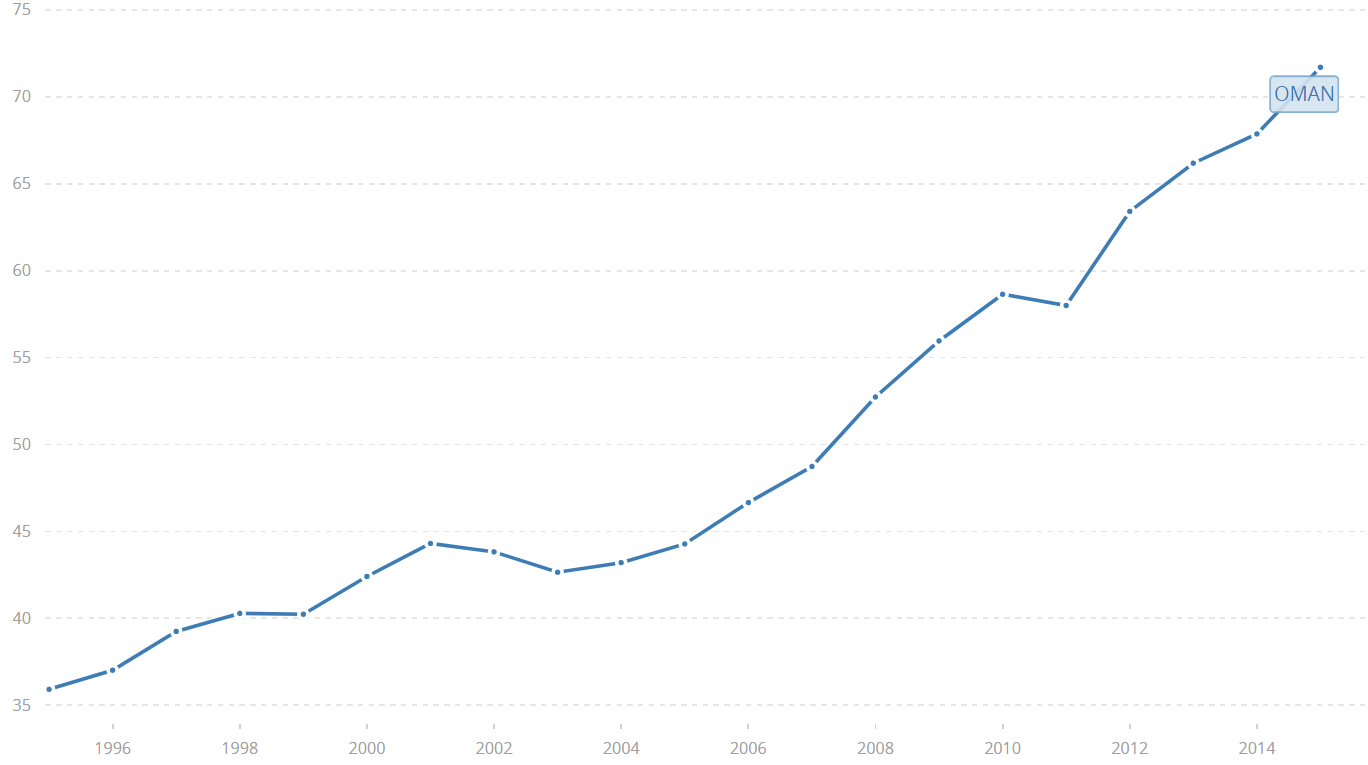
Looks pretty good, right? However, when you look at per capita figures (in thousands constant 2010 US$), you will see that production did not completely catch up with population growth:
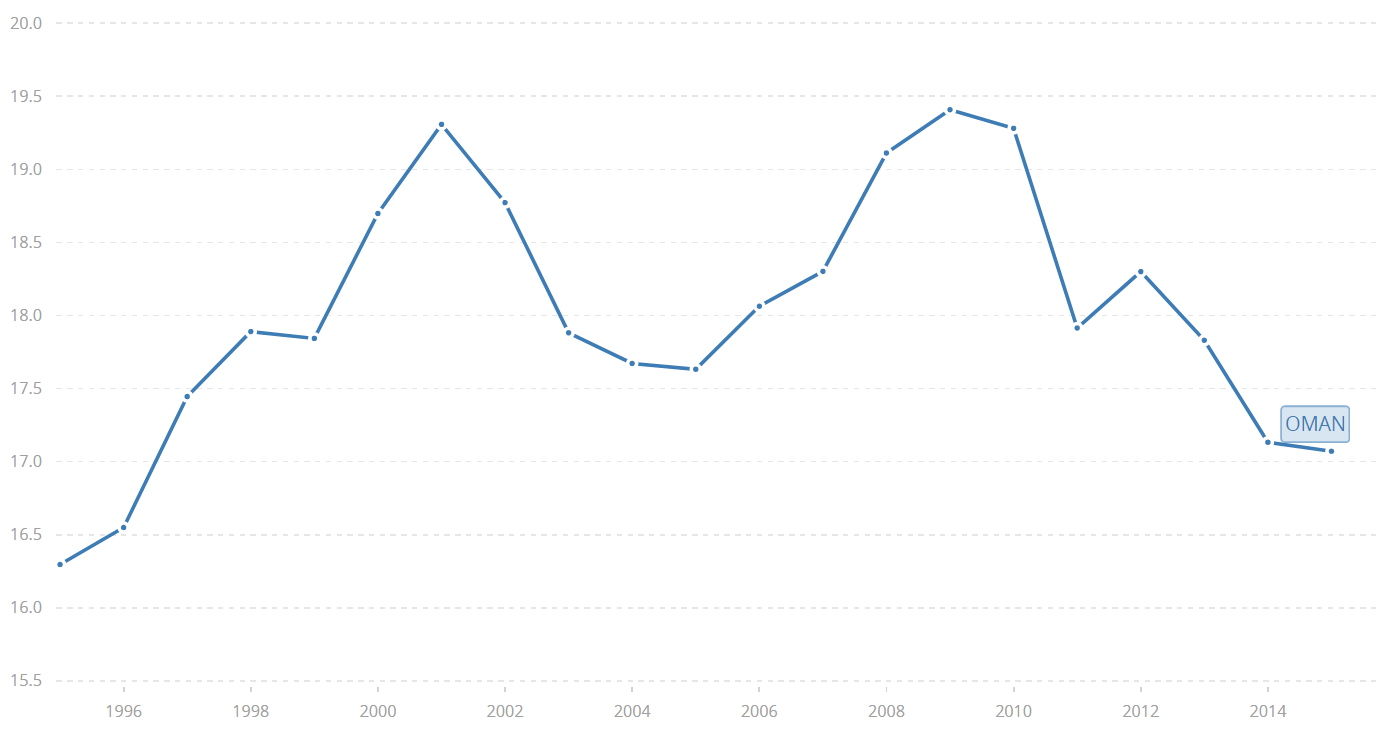
Note: To get real GDP per capita, search for GDP per capita (constant 2010 US$) in the World Bank database.
GDP per capita, PPP: Standard of living
The last indicator I will discuss in this article is GDP per capita, PPP (in international $), where “PPP” stands for “purchasing power parity”. You can find this indicator on the World Bank website as well (currently with the base year 2011).
The ordinary GDP per capita tells you how much money there is in the economy per person, on average. However, from an individual point of view, it is better to earn $1000 and spend $500 a month on basic needs than to earn $2000 and spend $1800 on basic needs. That’s where PPP conversion comes into play.
Whenever you see any sum of money originating from a foreign country converted into “dollars (PPP)”, it means, simply put, that you look at how much food, utilities, electronics, housing, etc., you could buy with the given amount of money in that country. Then you calculate how much all these products would cost in the United States, on average, and that’s the original sum converted to dollars, PPP.
This is the best type of GDP to use if you want to compare standards of living between countries. For example, the GDP per capita of Qatar was $59,330 in 2016, only 60% of that of Luxembourg. However, Qatar’s GDP per capita, PPP, was $127,522, the highest in the world and almost 30% more than that of Luxembourg. The reason is that Luxembourg is a much more expensive place to live in.