Tip: Are you a non-native English speaker? I have just finished creating a
  Web App
Programme for International Student Assessment (PISA) organized by the OECD is one of the most reliable wide-scale standardized student assessment studies in the world. In 2015, more than half a million 15-year-old students completed tests in science, reading, and mathematics.
PISA emphasizes the students’ ability to think independently rather than to rely on memorized methods and results, which makes it well suited for comparison of different education systems.
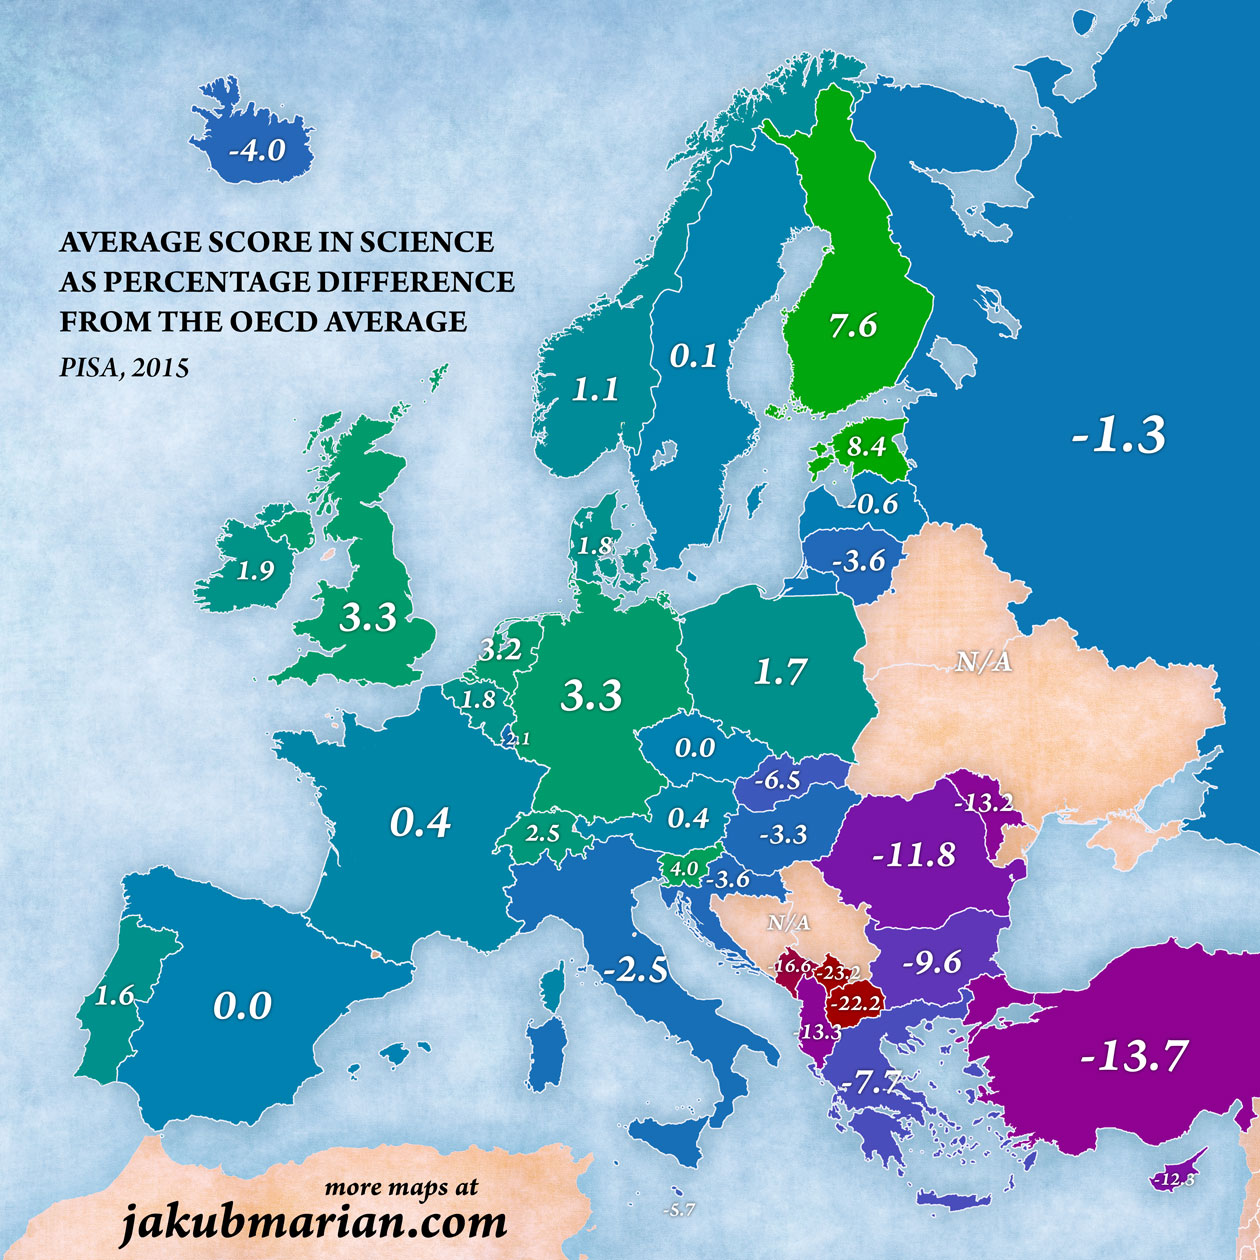
The main focal point of PISA 2015 was science. The study tested the students’ ability to “explain phenomena scientifically, evaluate and design scientific enquiry, and interpret data and evidence scientifically”. The highest-achieving country in science (as well as in all other disciplines) was Singapore, whose students scored 12.7% above the OECD average.
Other major world countries scored as follows: United States 0.7%, Japan 9.2%, Brazil -18.7%, China 5.0% (only includes provinces Beijing, Shanghai, Jiangsu, and Guangdon), all numbers relative to the OECD average (negative numbers indicate percentages below the OECD average). European countries had the following average scores:
It should be noted that the results for Luxembourg may not entirely reflect the real situation because Luxembourgish students had to choose between the German and the French version of the test, although the native language of the majority of them is neither of those.
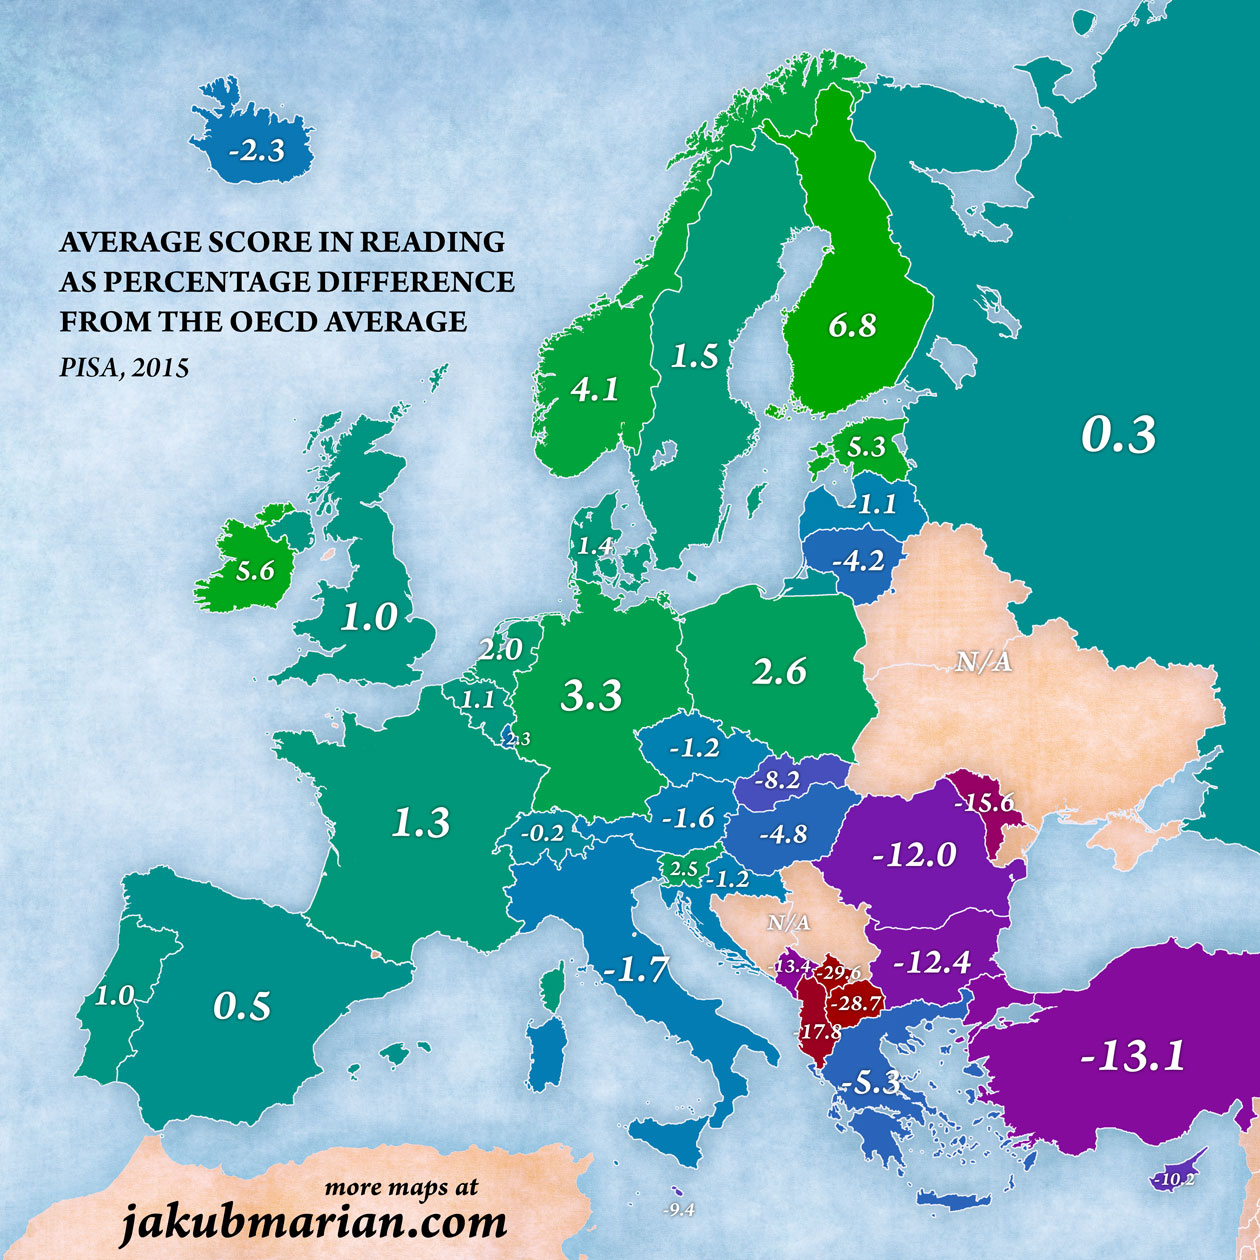
The study also tested reading abilities (the ability to retrieve, interpret, and evaluate texts). The highest-scoring participant was Singapore at 8.5% above the OECD average.
Other major world countries scored as follows: United States 0.8%, Japan 4.7%, Brazil -17.4%, China 0.2% (only includes provinces Beijing, Shanghai, Jiangsu, and Guangdon), all numbers relative to the OECD average. European countries had the following scores:
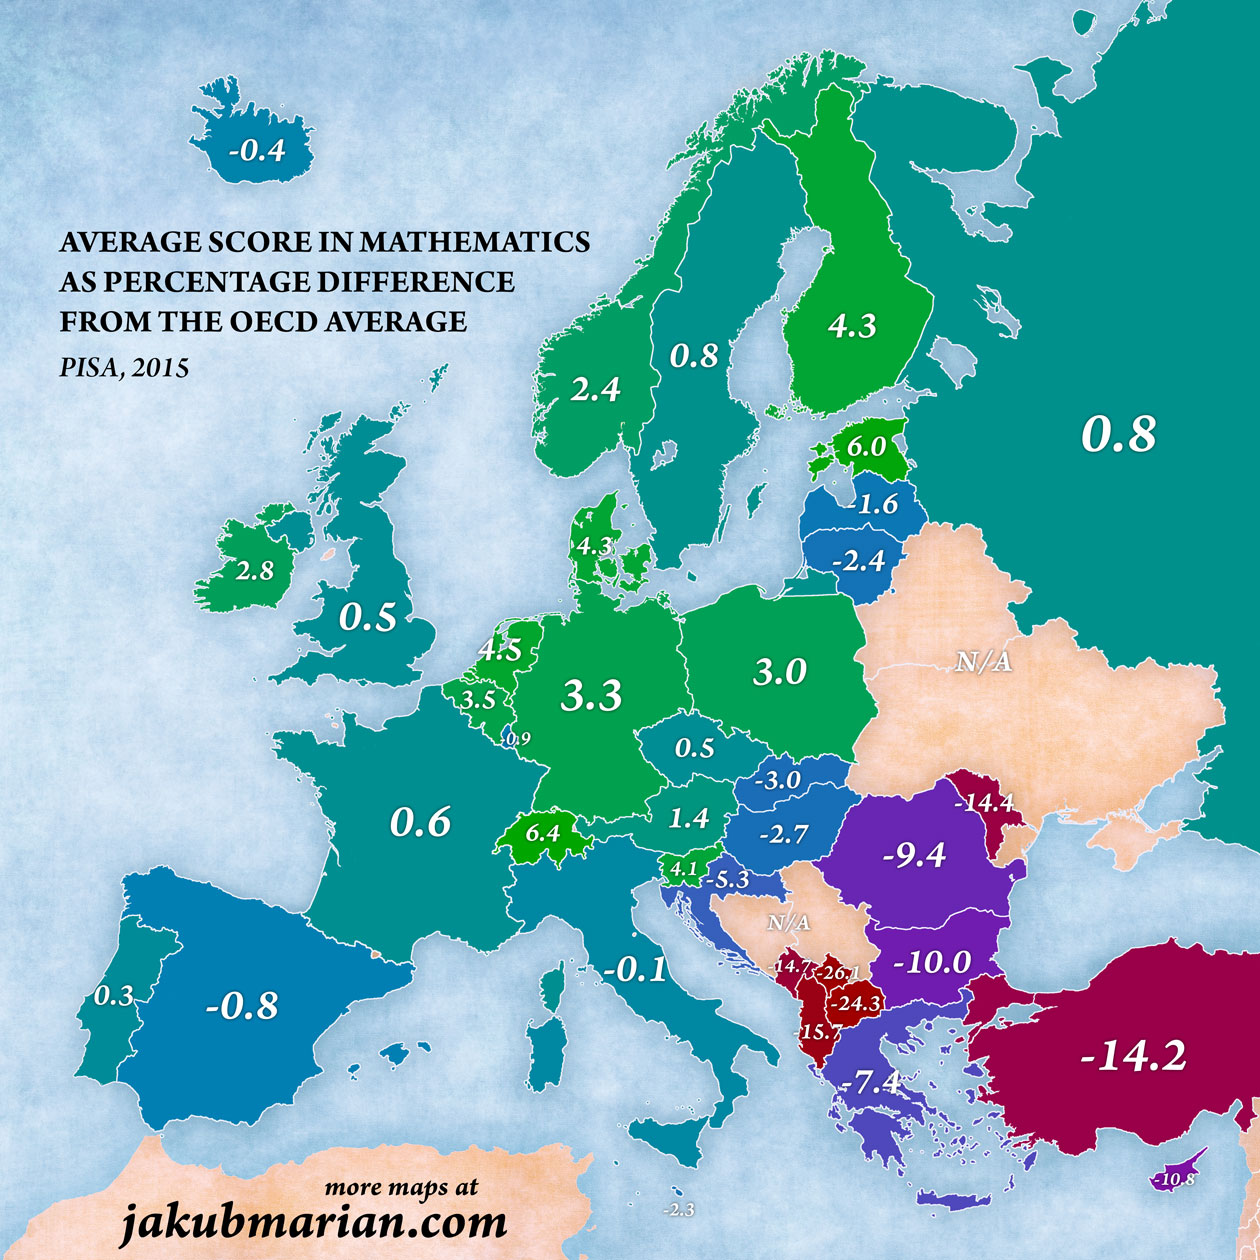
The last tested skill was mathematics (with the main points being to “recognise, offer and evaluate explanations for a range of natural and technological phenomena”, according to the PISA website). Again, the highest-scoring country was Singapore with 15.1% above the OECD average.
Other major world countries scored as follows: United States -4.2%, Japan 8.7%, Brazil -23.0%, China 8.4% (only includes provinces Beijing, Shanghai, Jiangsu, and Guangdon), all numbers relative to the OECD average. European countries had the following scores:
OECD also provides some regional data, but only those for Spain are complete. However, they illustrate an important principle, so let’s take a look at the scores of Spanish autonomous communities in mathematics (with colouring corresponding to the map above):
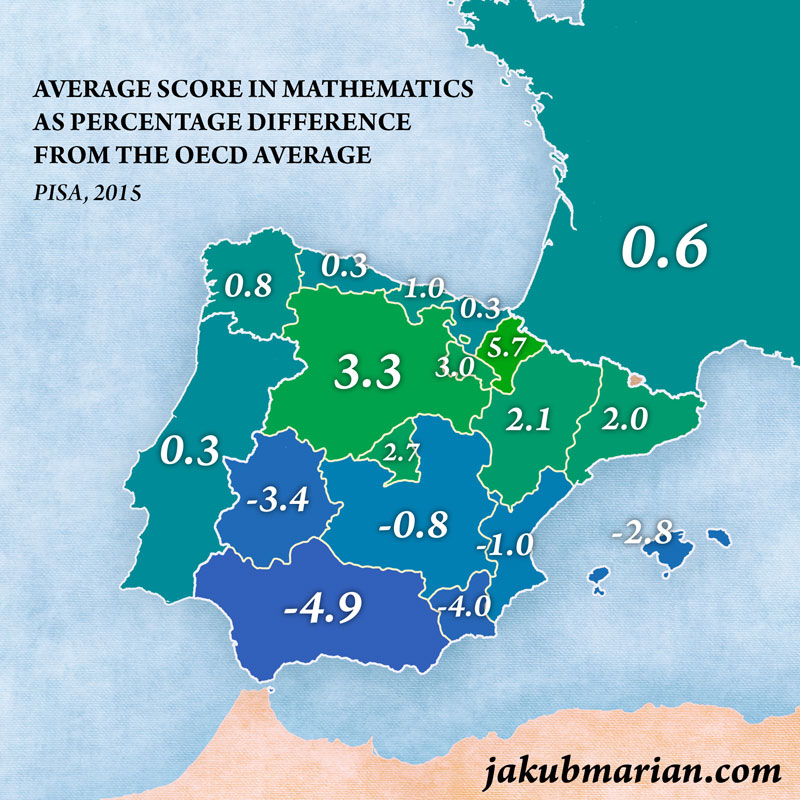
As you can see, richer northern regions tend to perform significantly better than poorer southern regions. We would probably see similar differences in other countries if regional data were available (especially in Italy, which typically shows a similar North-South divide as Spain), so the averages over all regions within one country have to be taken with a pinch of salt.