Tip: Are you a non-native English speaker? I have just finished creating a
  Web App
The number of patent applications is a good indicator of how innovative businesses in different regions are. Without further ado, let’s take a look at a map showing the number of patent applications to the European Patent Office (EPO) per 1 million inhabitants (averaged over the years 2008–2012, which are the most recent entries available in the Eurostat database as of 2017):
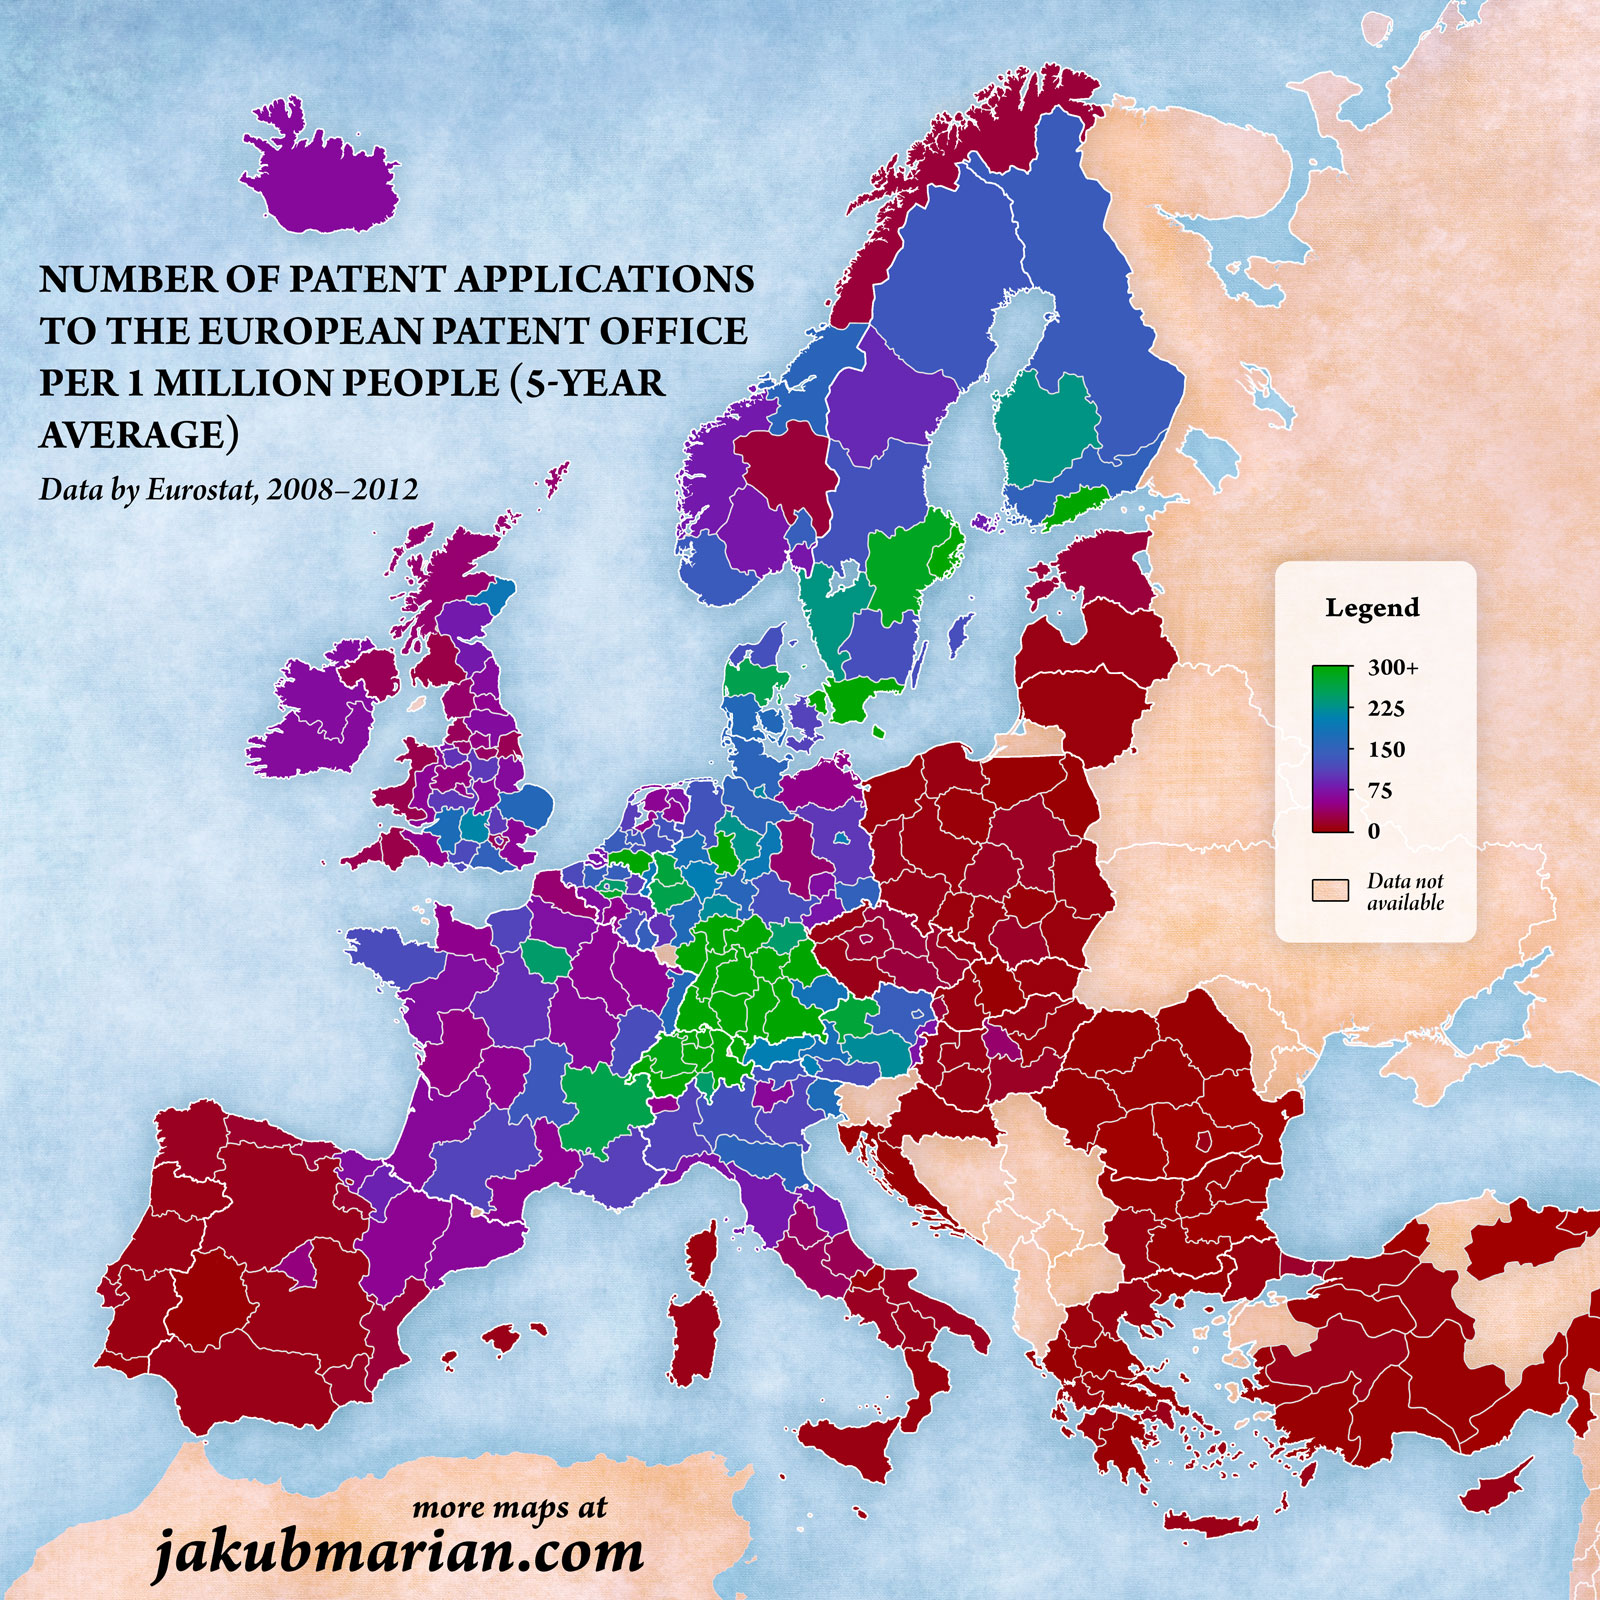
5 top-scoring regions were as follows:
| # | Region | Patent applications per year 1 million inhabitants |
|---|---|---|
| 1 | Vorarlberg, Austria | 612 |
| 2 | Northwestern Switzerland | 607 |
| 3 | North Brabant, Netherlands | 592 |
| 4 | Stuttgart, Germany | 574 |
| 5 | Mittelfranken, Germany | 541 |
One note on methodology is in order here: The figures may fluctuate by up to ±50% from year to year in some regions, which is why I decided to take the average of the 5 most recent entries available (2008–2012). There are a few regions where the data for some years between 2008 and 2012 are missing, in which case the average is calculated from a smaller sample.