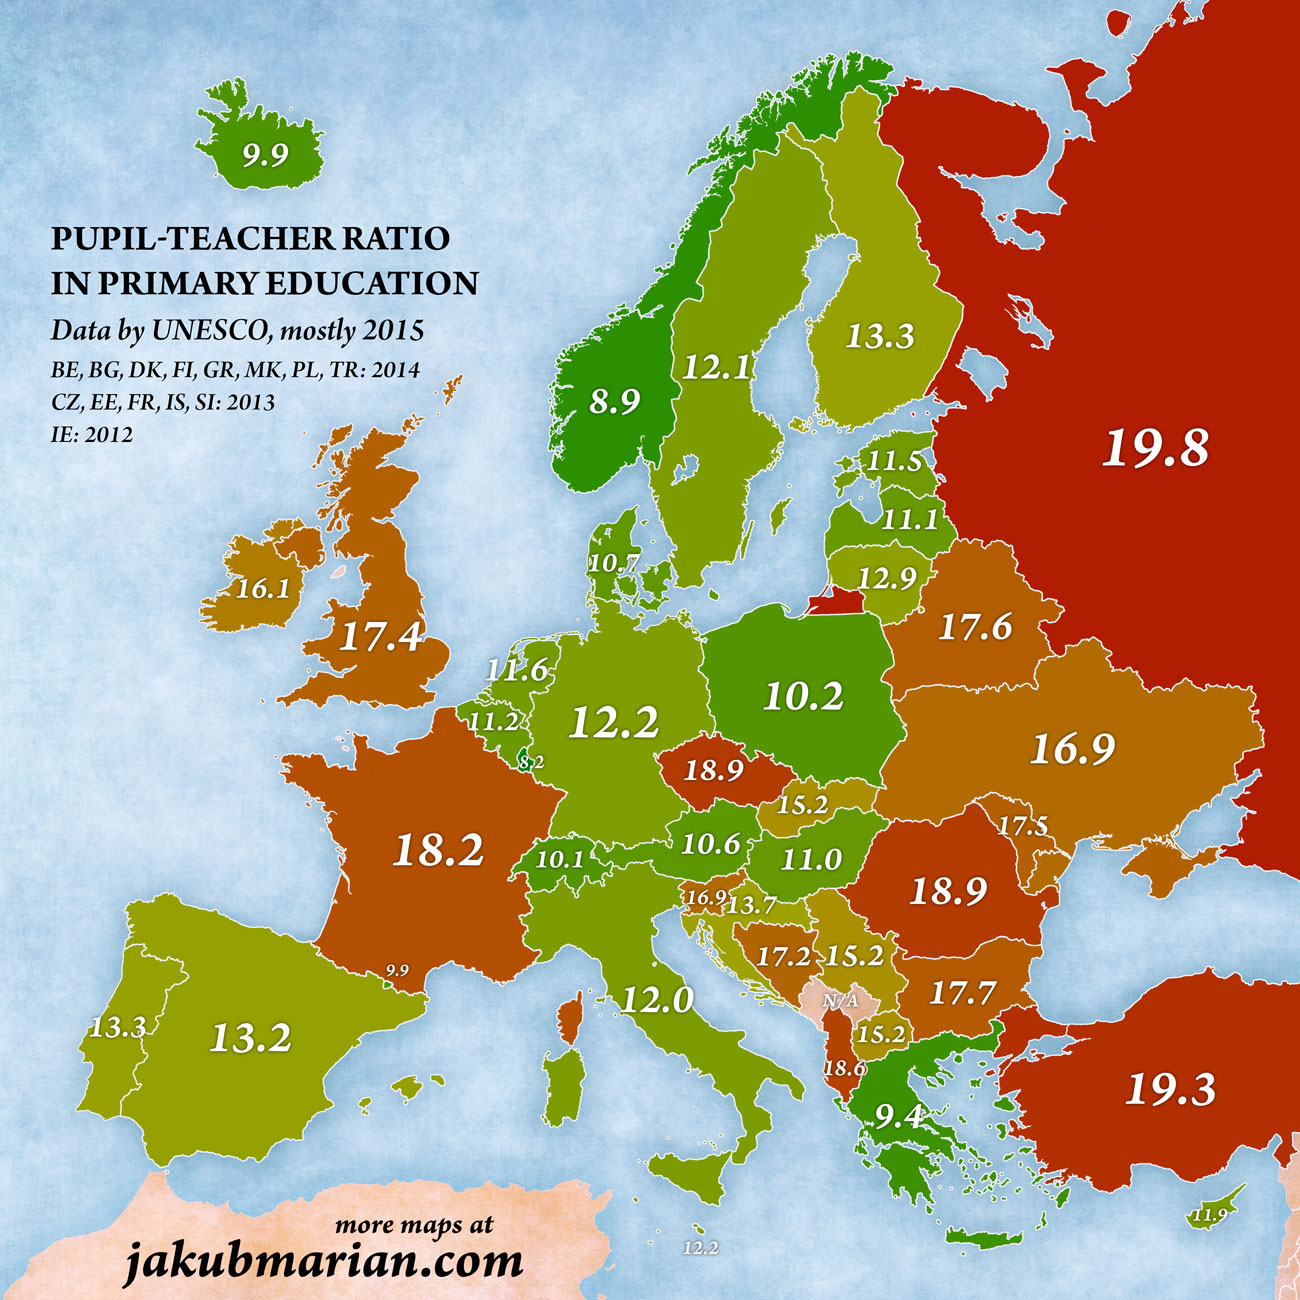
When it come to class size, the relationship is quite obvious: The fewer students a teacher has, the more time she or he can devote to each student, which in turn leads, on average, to a better quality of education.
Teachers in developing countries generally have to handle many more children than teachers in developed countries, reaching a whopping 69.5 pupils per teacher in Malawi or 62.4 pupils per teacher in Chad, while no European country has more than 20 pupils per teacher in primary education (the map is based on data by UNESCO):

For comparison, here are the corresponding values for other major nations: United States 14.5, China 16.3, Japan 16.4, Brazil 20.9, India 31.5.
The number of teachers used in the calculation is converted to the “equivalent” of a full-time teacher, so the data are not skewed by several teachers working part-time rather than one teacher working full-time.
It should be noted that class sizes can be larger than the figures shown in the map because teachers do not spend the whole time teaching. For instance, if a class has 30 hours of school per week but one particular teacher spends only 25 hours teaching, the rest being taught by another teacher, the class size is 30/25 = 1.2 times larger than the pupil–teacher ratio.
This rarely happens in years 1 to 5, but it does happen in years 6 and 7, which are included in primary education in some countries. Whenever this is the case, the number given in the map is an underestimation of class size.
Another thing to note that the values include teachers and students in special education. Special-needs students generally work in smaller groups and have more teachers than regular students, which drives the average under the typical rate of regular students.
 Tip: Are you a non-native English speaker? I have just finished creating a
  Web App
