This article clarifies the methodology I use to represent the linguistic situation in Ukraine in my linguistic maps, such as the map of the names of Germany. My maps show etymological relations among words in different languages, and to represent the situation in Ukraine accurately, up to five different colours may be needed.
When all neighbouring languages have different colours (due to having words based on different roots), the situation in Ukraine may look as follows:
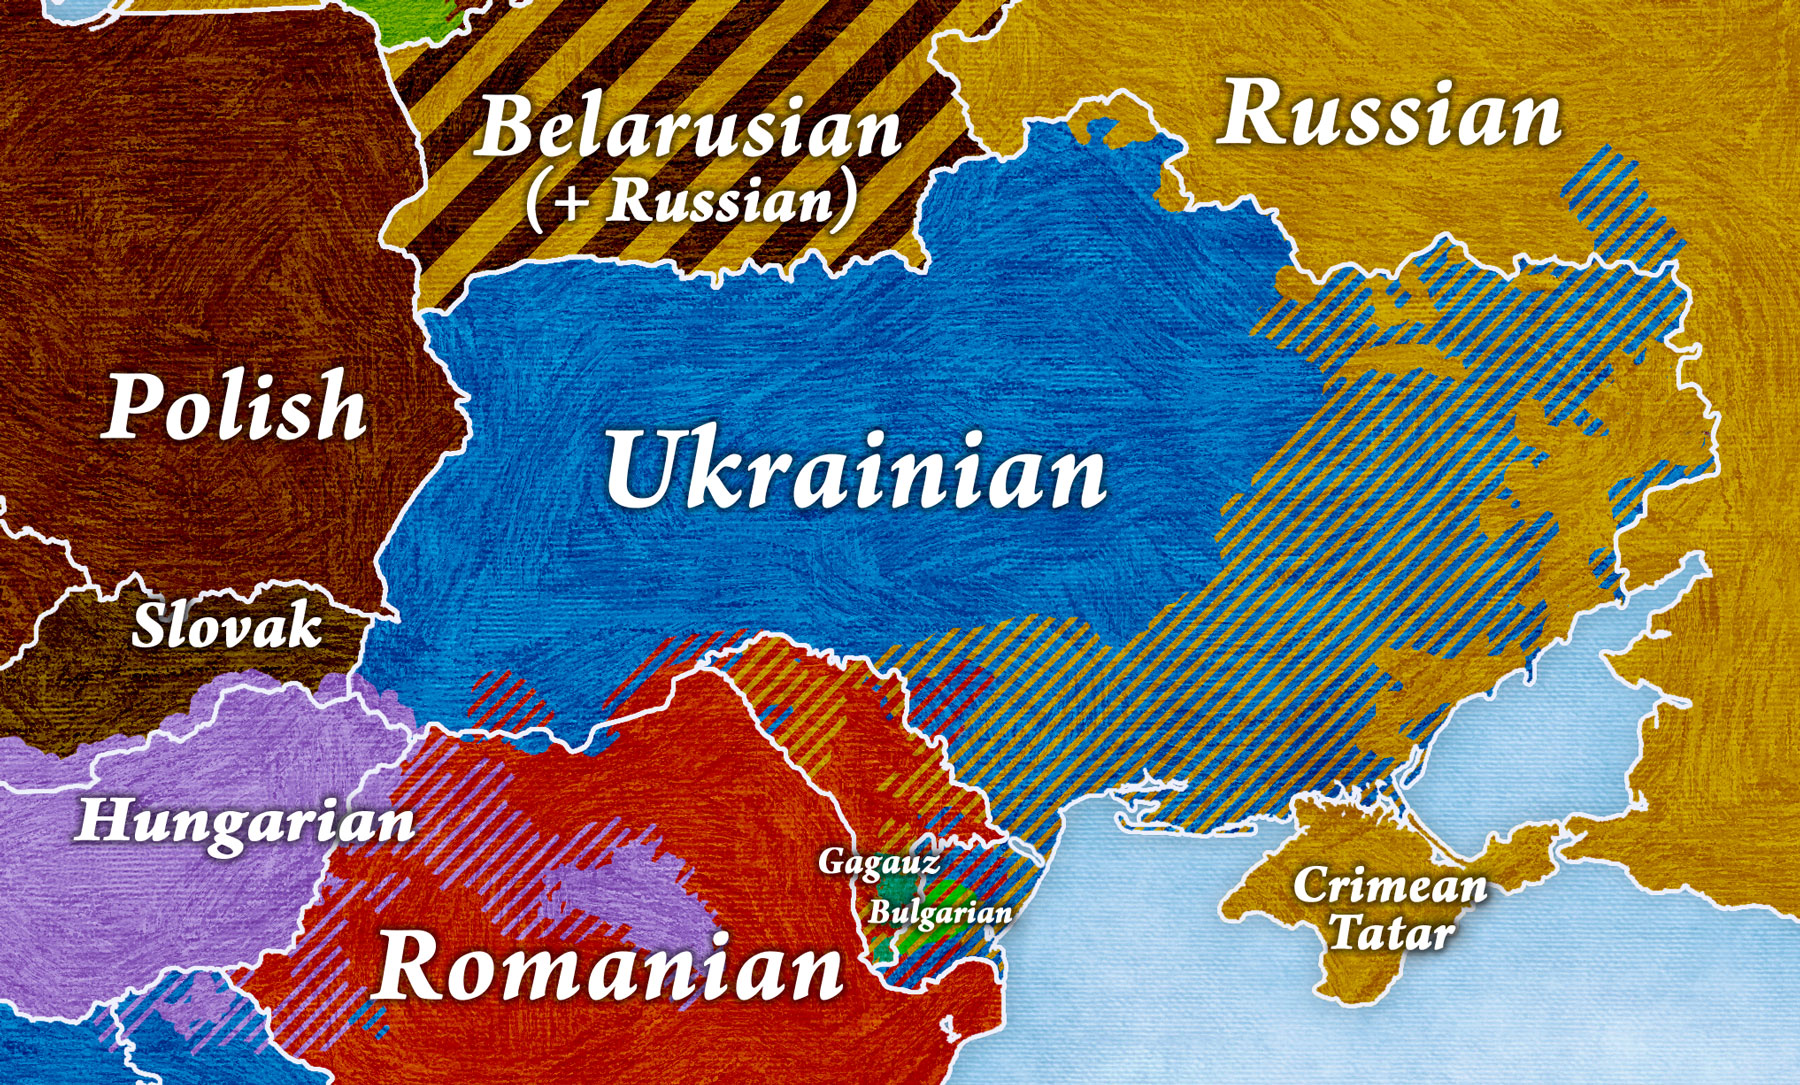
Before I talk about the way I came to this particular colouring, I should explain what the colours represent. Solid colours represent a language spoken by more than 50% of the population, so, for example, the pink blob in Romania represents a region inhabited mostly by Hungarians.
When there is a significant minority language, it is indicated with stripes. A minority language is, by definition, a language that is minority in the given country, not just within the area where it is spoken; it is implicitly understood that the national language may also be spoken in areas with more than 50% of speakers of another language.
A note on the border
One note is in order here. Sometimes I get accused of supporting the Russian occupation of Crimea because there is a border separating Ukraine and Crimea. However, this is not a border; it is a coastline, which looks continuous because Crimea is almost entirely separated from the mainland by a body of water and the connecting piece of land is thinner than the resolution at which the map was drawn at some points, so it was more practical to draw it as an island.
This does not imply support for any territorial claims, and in many of my statistical maps, Crimea shares the colour of Ukraine, if that’s appropriate in the particular context.
Russian
Since Russian colours in Ukraine cause most of the controversy around my maps (because some people wrongly assume that colours represent territorial claims of countries), let’s deal with Russian first. The regions shown as Russian-speaking are essentially based on the following map from the Ukrainian 2001 census (source), which shows the majority language by region (red = Russian, blue = Ukrainian):
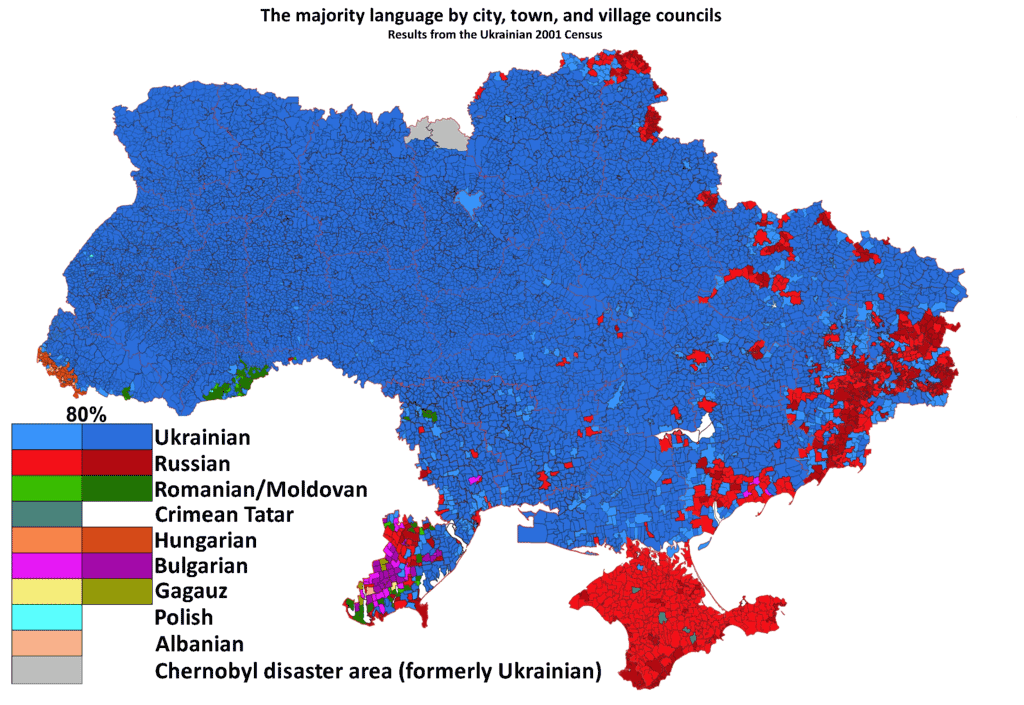
As for the striped part, drawing the striped regions according to percentages in separate municipalities and towns does not seem to be a viable option (Ukrainian population is highly mixed, and the percentages vary significantly even between neighbouring municipalities; furthermore, the best available source is more than 15 years old). That is why I decided to base the colouring on the following map (source):
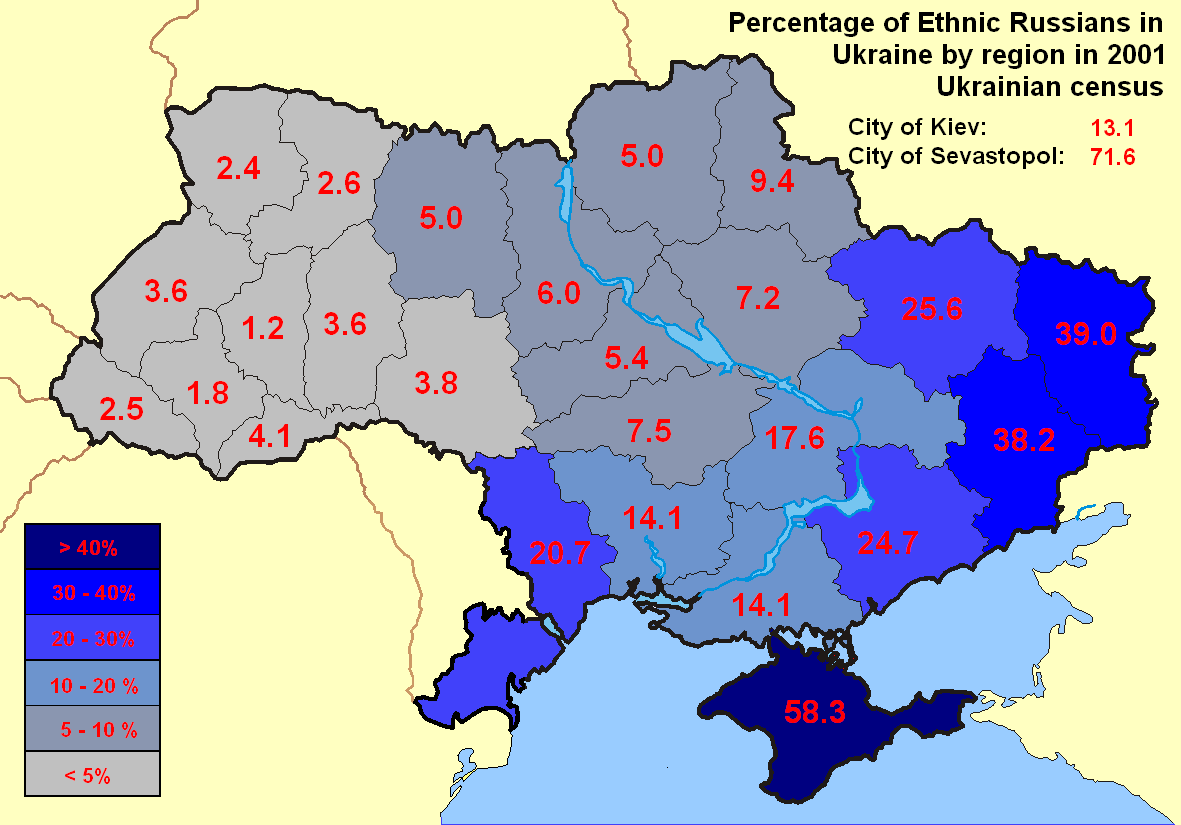
Oblasts (regions) that have 10% or more Russian population are shown with stripes in my maps. The stripes should therefore be understood as an indication that there is a significant Russian-speaking minority in the eastern oblasts, but the border between the striped and non-striped regions is not an accurate representation of the distribution of the Russian-speaking population at the municipal level.
Please note that I previously put stripes on the Sumy Oblast that has almost 10% of Russian population (because it contains two clusters where Russian is the majority language), but later decided to strictly follow the general criterion that I also use in other countries (i.e. more than 10%) and removed the stripes. As a result, my older maps may show the Sumy oblast with stripes.
Crimean Tatar
Let’s move on to other minority languages in Ukraine. One of the most significant ones is Crimean Tatar, spoken in Crimea. The following map shows the percentages of Crimean Tatars in Crimea by region (source):
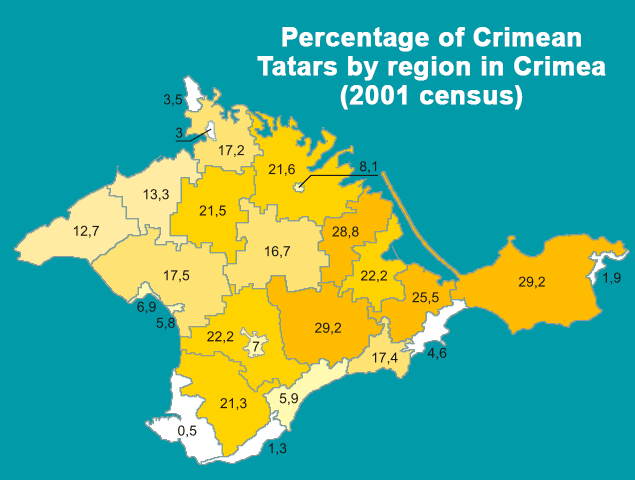
Since the majority language of Crimea is Russian and Crimean Tatars are numerous but do not form a majority anywhere, I decided to show Crimean Tatar as stripes on “Russian” background.
Romanian
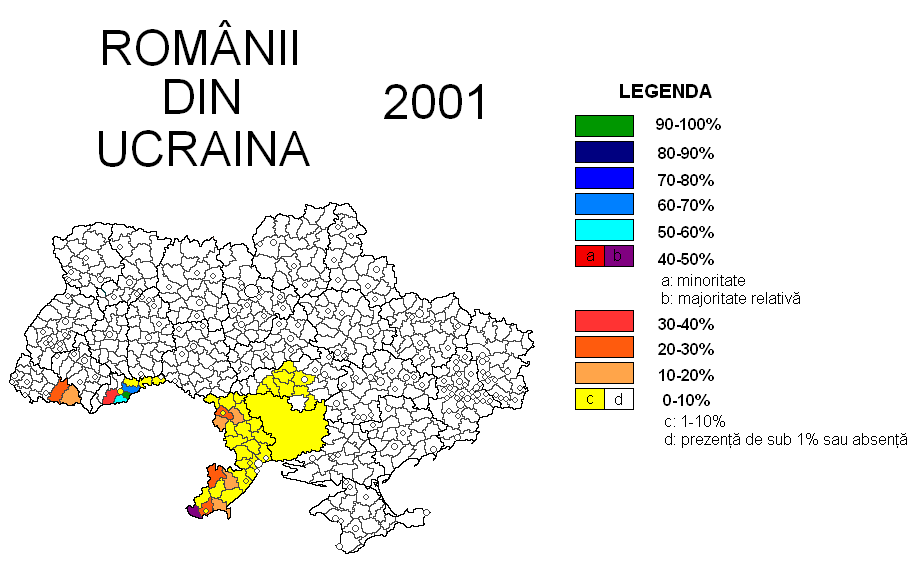
As can be seen from the map I used to draw the Russian-speaking areas, Romanian is also present in Ukraine. While that map shows only the majority areas, the following map (source) shows the percentages of Romanians and Moldovans in Ukraine, and the red-striped areas in my map correspond to values 10% and more:
Hungarian
Hungarian is also spoken in Ukraine, by ethnic Hungarians living near the Hungary–Ukraine border, as shown in the following map:
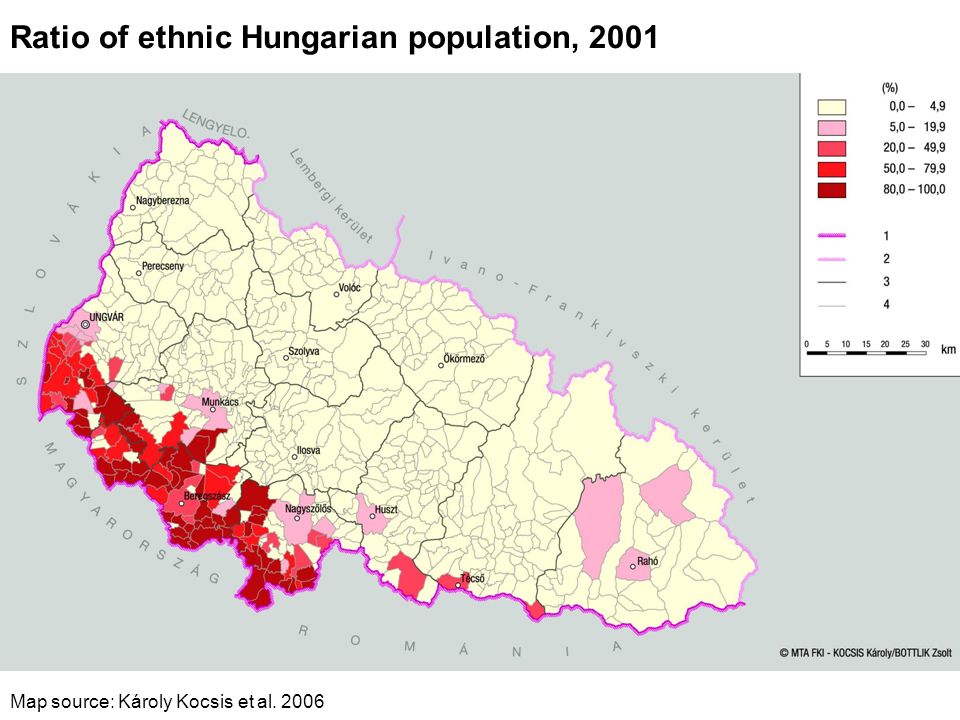
Interestingly, there do not seem to be many areas with more than 5% but less than 50% Hungarians, so I simply show the Hungarian language as a solid colour.
Bulgarian
Finally, there is an area in the south of Ukraine (in the Odessa Oblast) inhabited mostly by Bulgarians (source):
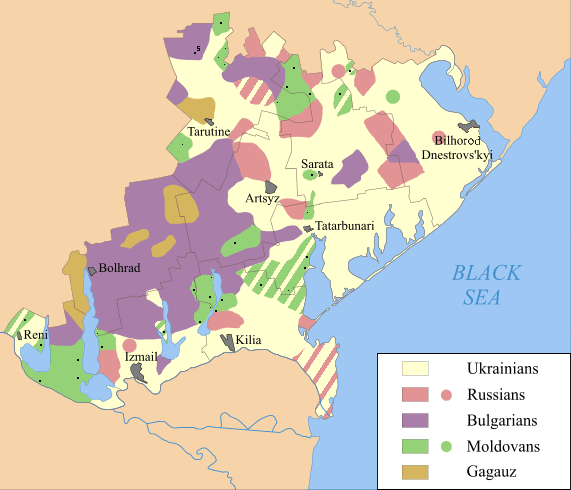
The situation in this region is too complex to be shown accurately in my maps, so should the need for showing Bulgarian in Ukraine arise, it will be shown as a solid colour underneath Romanian and Russian stripes, while the Gagauz language will only be shown in Moldova.
 Tip: Are you a non-native English speaker? I have just finished creating a
  Web App