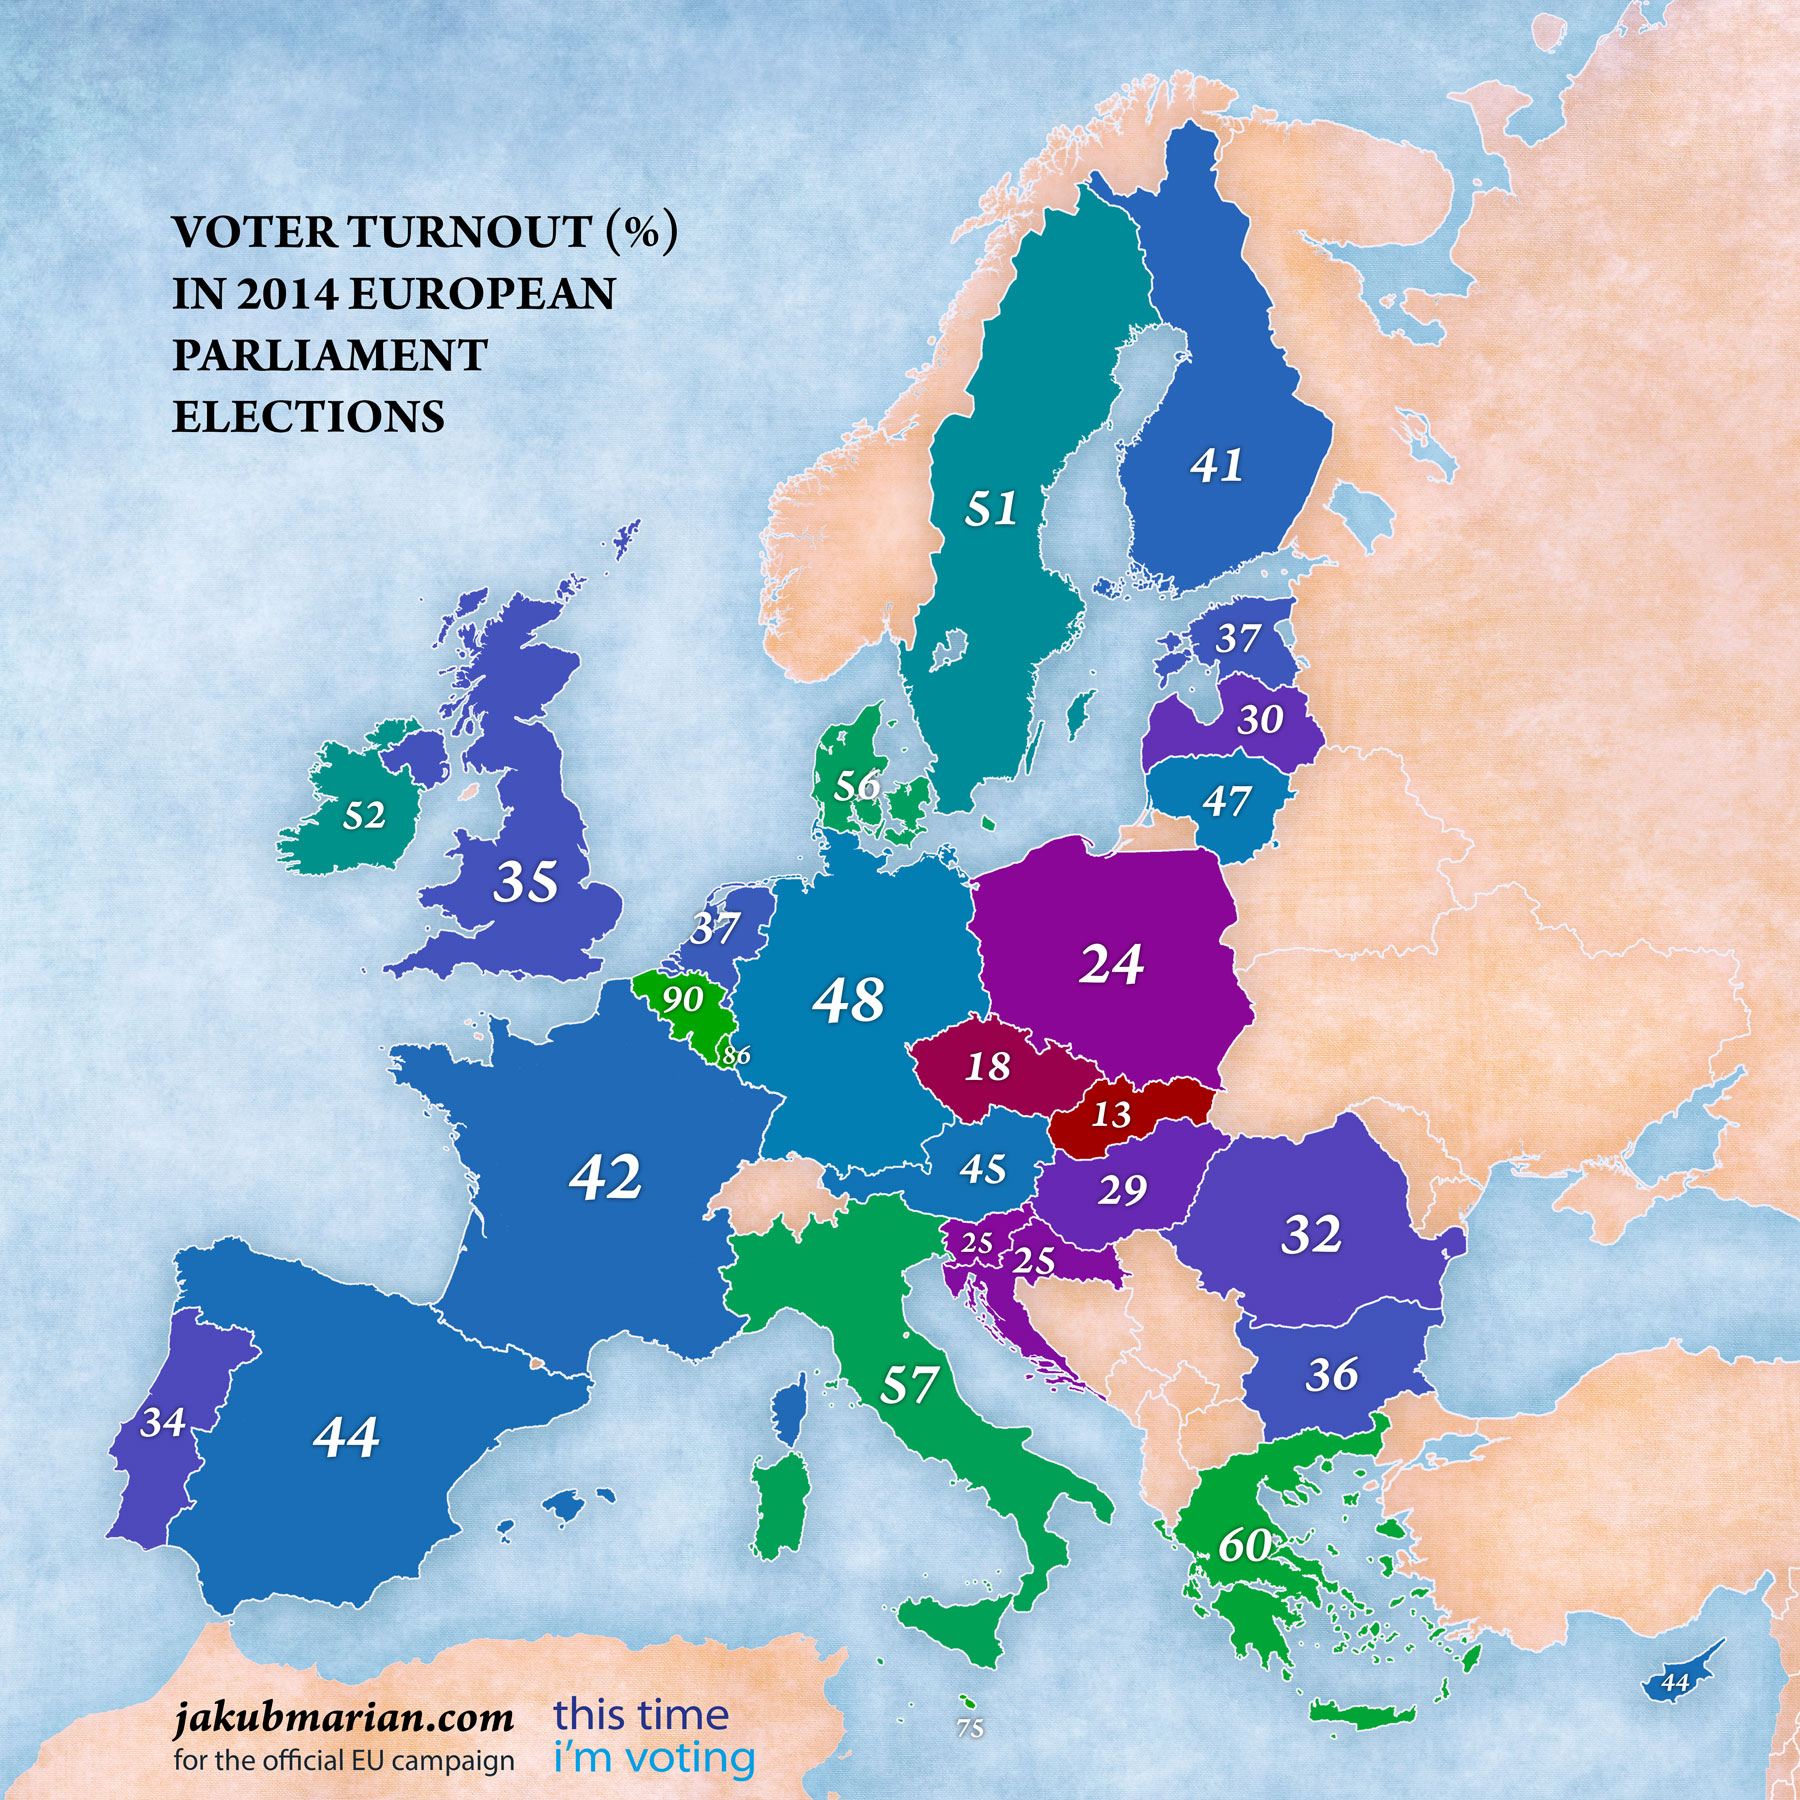
According to the official 2014 post-election survey, 43% of eligible voters cast their votes in the 2014 European Parliament elections. However, there are staggering differences between EU member states, as the following map shows:

Voter turnout seems to be particularly low in the new EU member states (i.e. the countries that joined in or after 2004), especially in the so-called V4 group, which includes Poland, Czech Republic, Slovakia, and Hungary, which have often been at odds with the current EU politics, especially in relation to the 2015 migrant crisis.
Since smaller countries have more voting power (per capita) than larger countries, it will be interesting to see whether there will be an upsurge of interest in the European elections in 2019.
It is worth noting that voting in Belgium and Luxembourg (which have the highest voter turnout of all EU member states) is compulsory, unlike other member states (except Greece, where voting is compulsory in theory, but the law is not strictly enforced).
 Tip: Are you a non-native English speaker? I have just finished creating a
  Web App
