 Tip: Are you a non-native English speaker? I have just finished creating a
  Web App
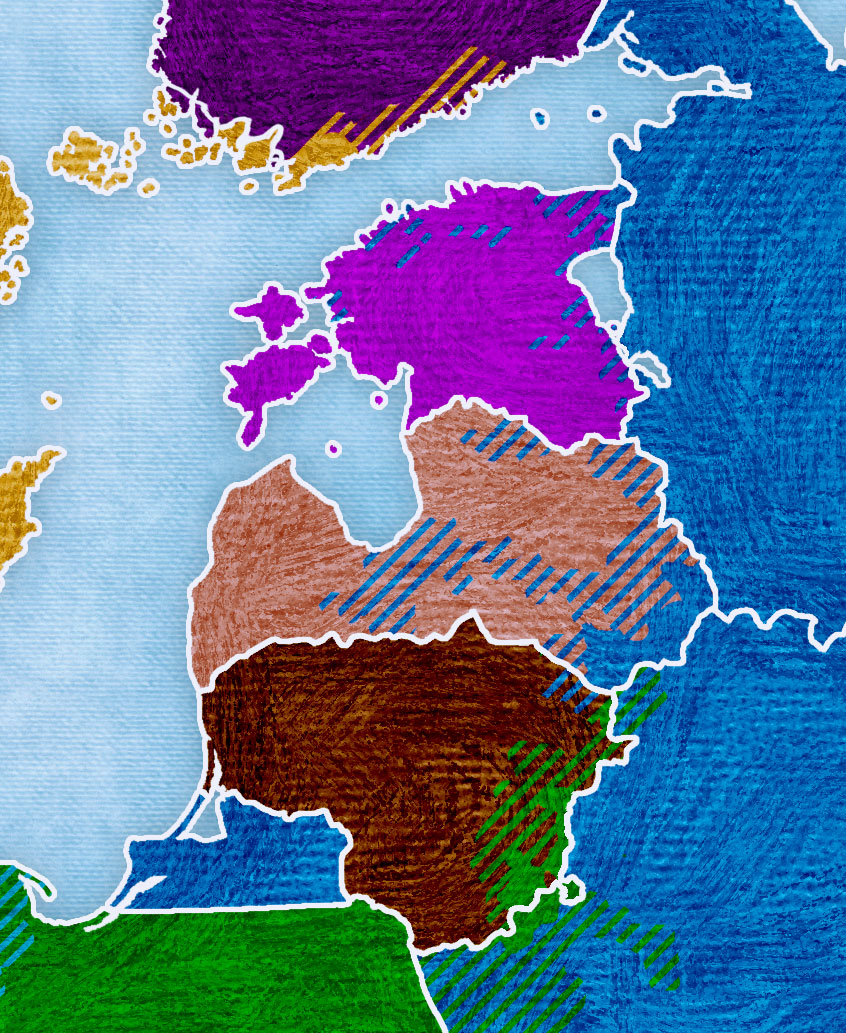
This article explains the methodology I used to generate the Estonian, Latvian, and Lithuanian part of my linguistic maps, such as this one. This part of the maps seems to be controversial because of the way Russian language is represented there. My maps of the region currently look as follows:
Estonia
The Estonian part of my map is based on the following map from the 2000 Estonian census, which shows the percentages of native Russian speakers by municipality (unfortunately, I am not aware of any newer map visualizing the same piece of data; if you happen to know one and it shows a different picture, I’ll be happy to update my maps; there is a map from 2011 by locality, but most localities are much smaller than 1px on my map and are thus unusable):
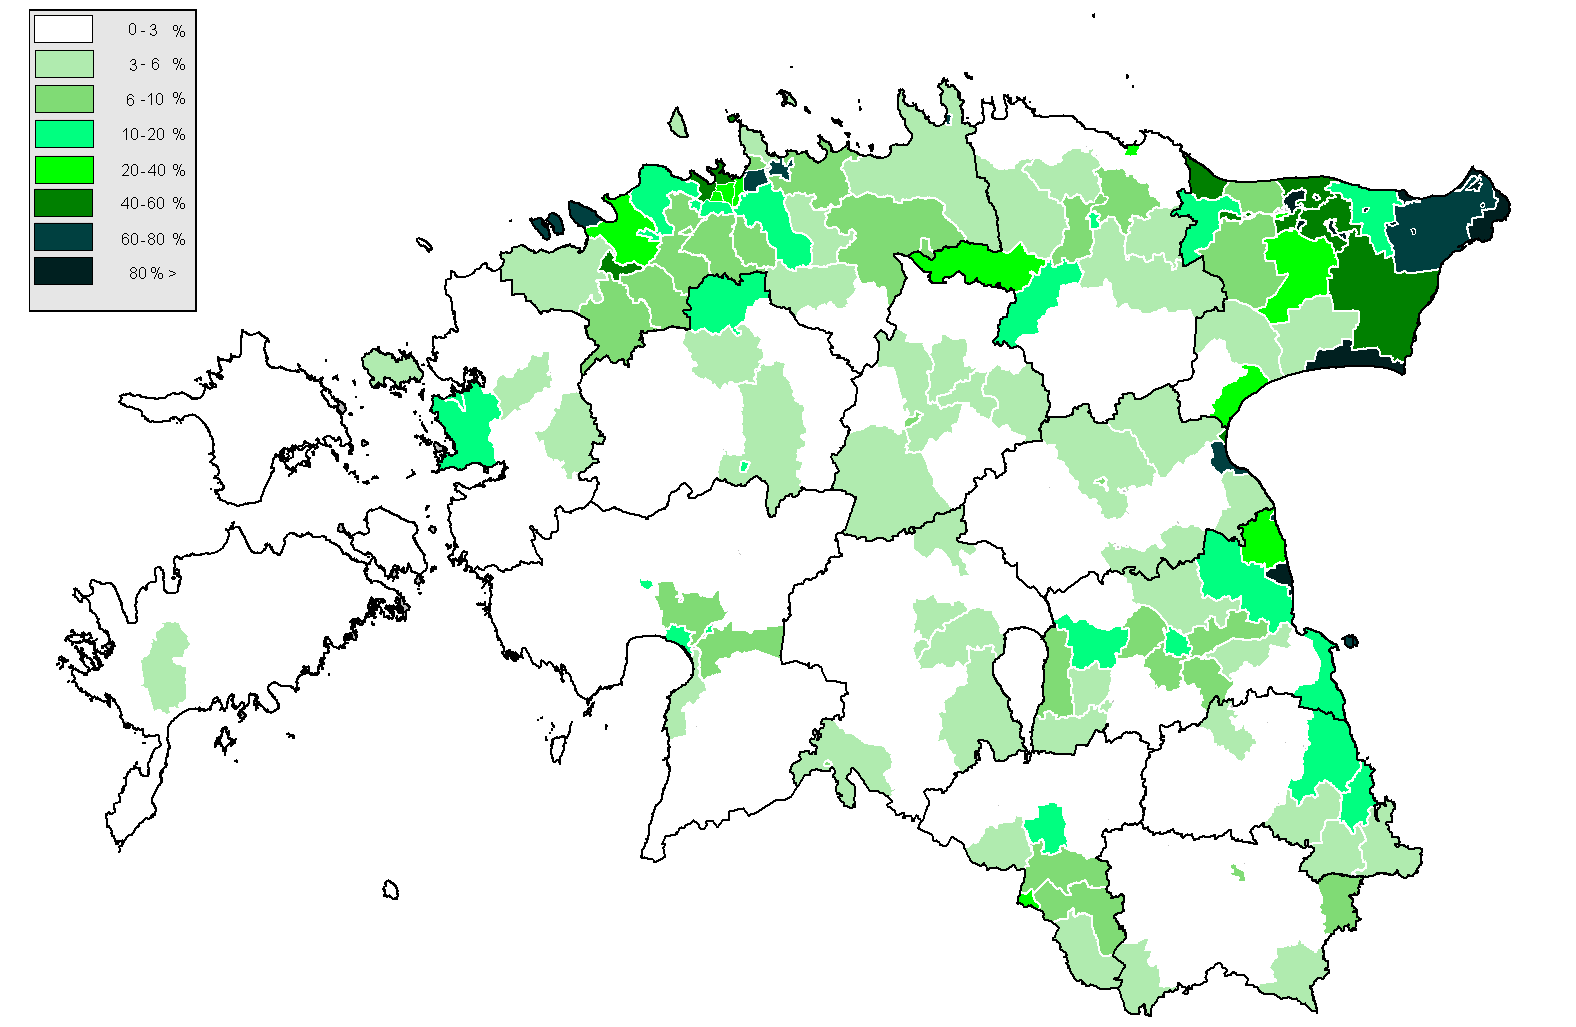
Russian-coloured stripes on the map of Estonia represent Estonian municipalities with more than 10% Russian-speaking population (bright green), and solid-coloured regions represent municipalities where a majority of the population speak Russian (dark blue and black).
It should be noted that around 25% of Estonians are ethnic Russians, but the map seems to underrepresent them, which is due to the fact that they are mostly concentrated in several small areas (some of which could not be shown on the map due to being too small).
Latvia
The Latvian part of my map is based on the following map from the 2011 Latvian census, which shows the percentages of the population that speak Russian at home:
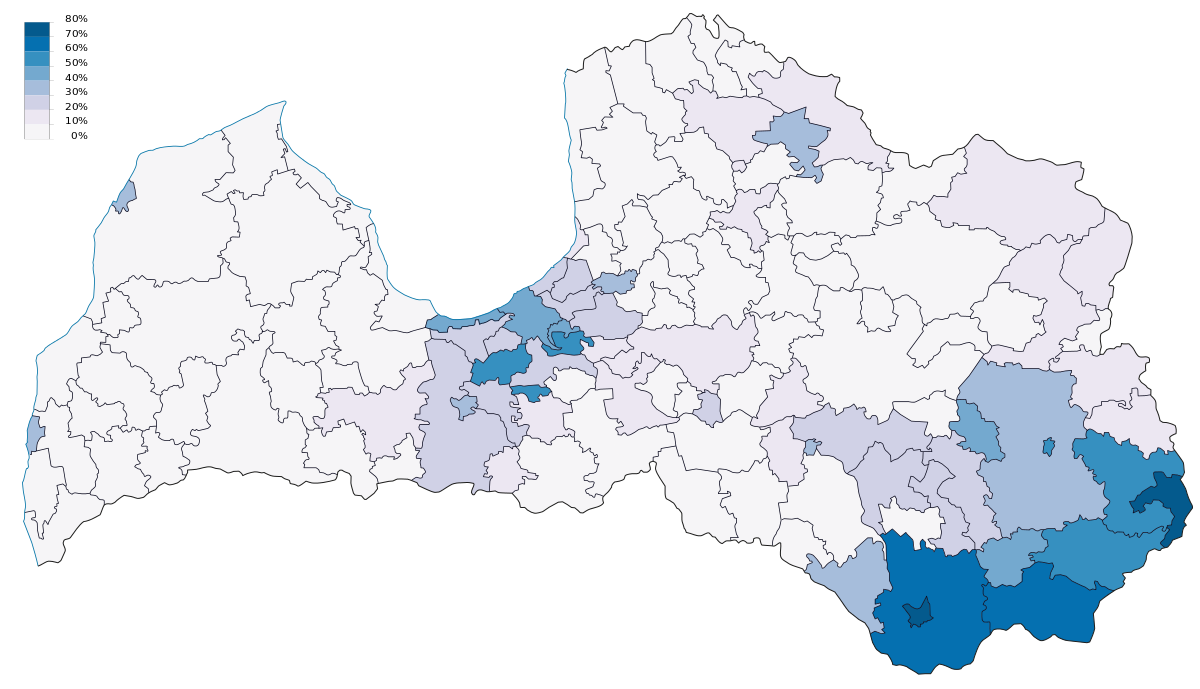
Like in the case of Estonia, striped regions represent municipalities where more than 10% of people speak Russian, and solid regions represent municipalities where a majority (more than 50% speak Russian).
Around 27% of the inhabitants of Latvia are ethnic Russians (according to the 2011 census). The map may make it seem like there are more Russians (percentagewise) in Latvia than Estonia, but this is due to the fact that they are more spread out.
Lithuania
The largest minority in Lithuania is Polish (6.6% of the population). The following map shows the percentages of native Polish speakers based on the 2011 Lithuanian census:
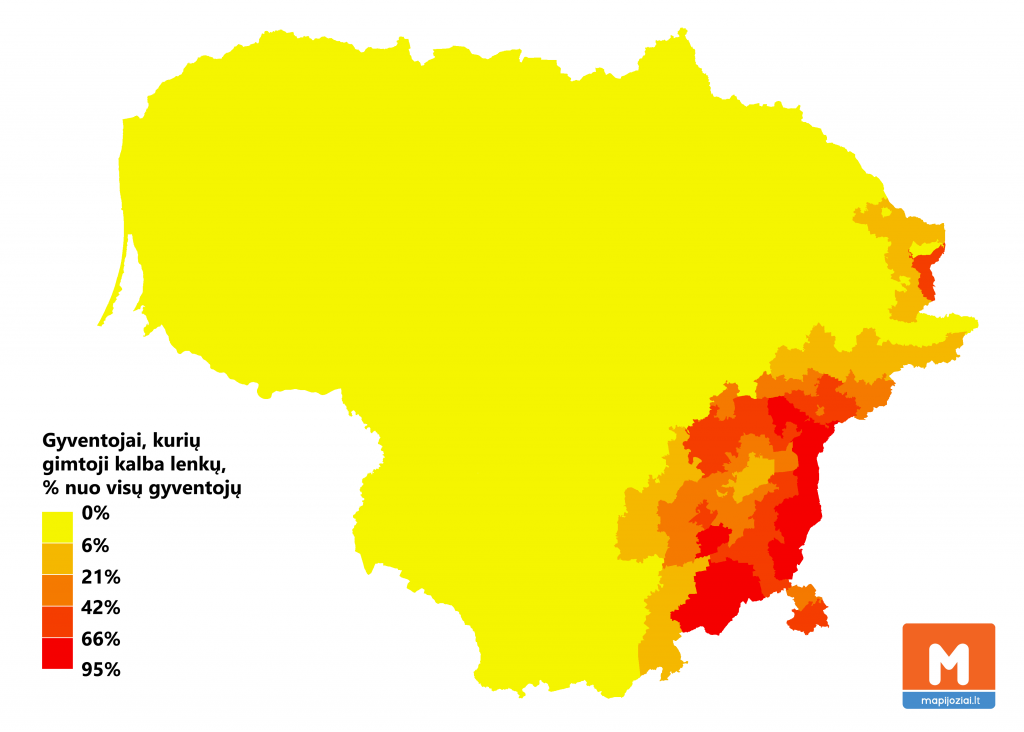
In this case, areas with 6% or more of Polish speakers are represented with stripes in my maps (21% is too high for a cut-off point). Areas with 66% or more Polish speakers are represented by a solid filled region (i.e. the regions where the majority is undoubtedly Polish).
Russians are also a significant minority in Lithuania (5.8%). However, there are fewer of them than the Poles in every municipality except the Zarasai (15%+) and Visaginas (30%+) municipalities, according to the following map:
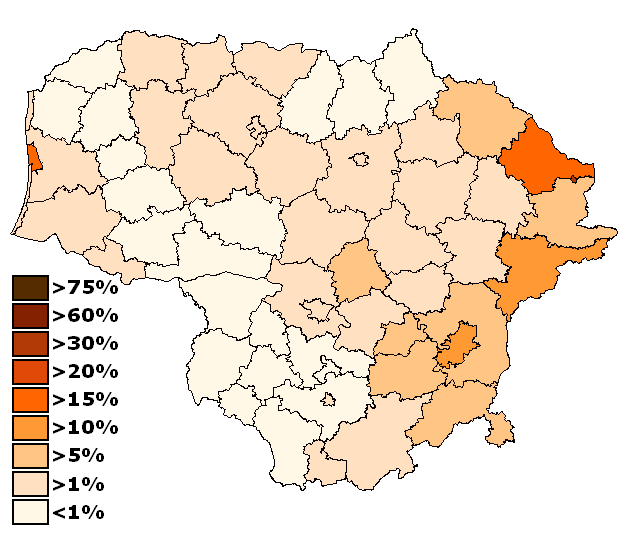
Since I do not show more than one linguistic minority per region, stripes representing the Russian minority are only present in the Zarasai municipality (the Visaginas municipality is the tiny spot next to it, which is too small to be represented on the map).

.svg)