Tip: Are you a non-native English speaker? I have just finished creating a
  Web App
The English Proficiency Index (EPI) by EF Education First is a rating of countries according to (presumably) the average level of English proficiency of their citizens. That, in itself, is not a bad idea. It may be useful to know how proficient people in different countries are if you want to conduct business there or optimize geotargeting on an international website, for example.
You can see the EF EPI of European countries on the map below. However, don’t take the results seriously; there are huge methodological flaws in the EF EPI study, which I will discuss below.
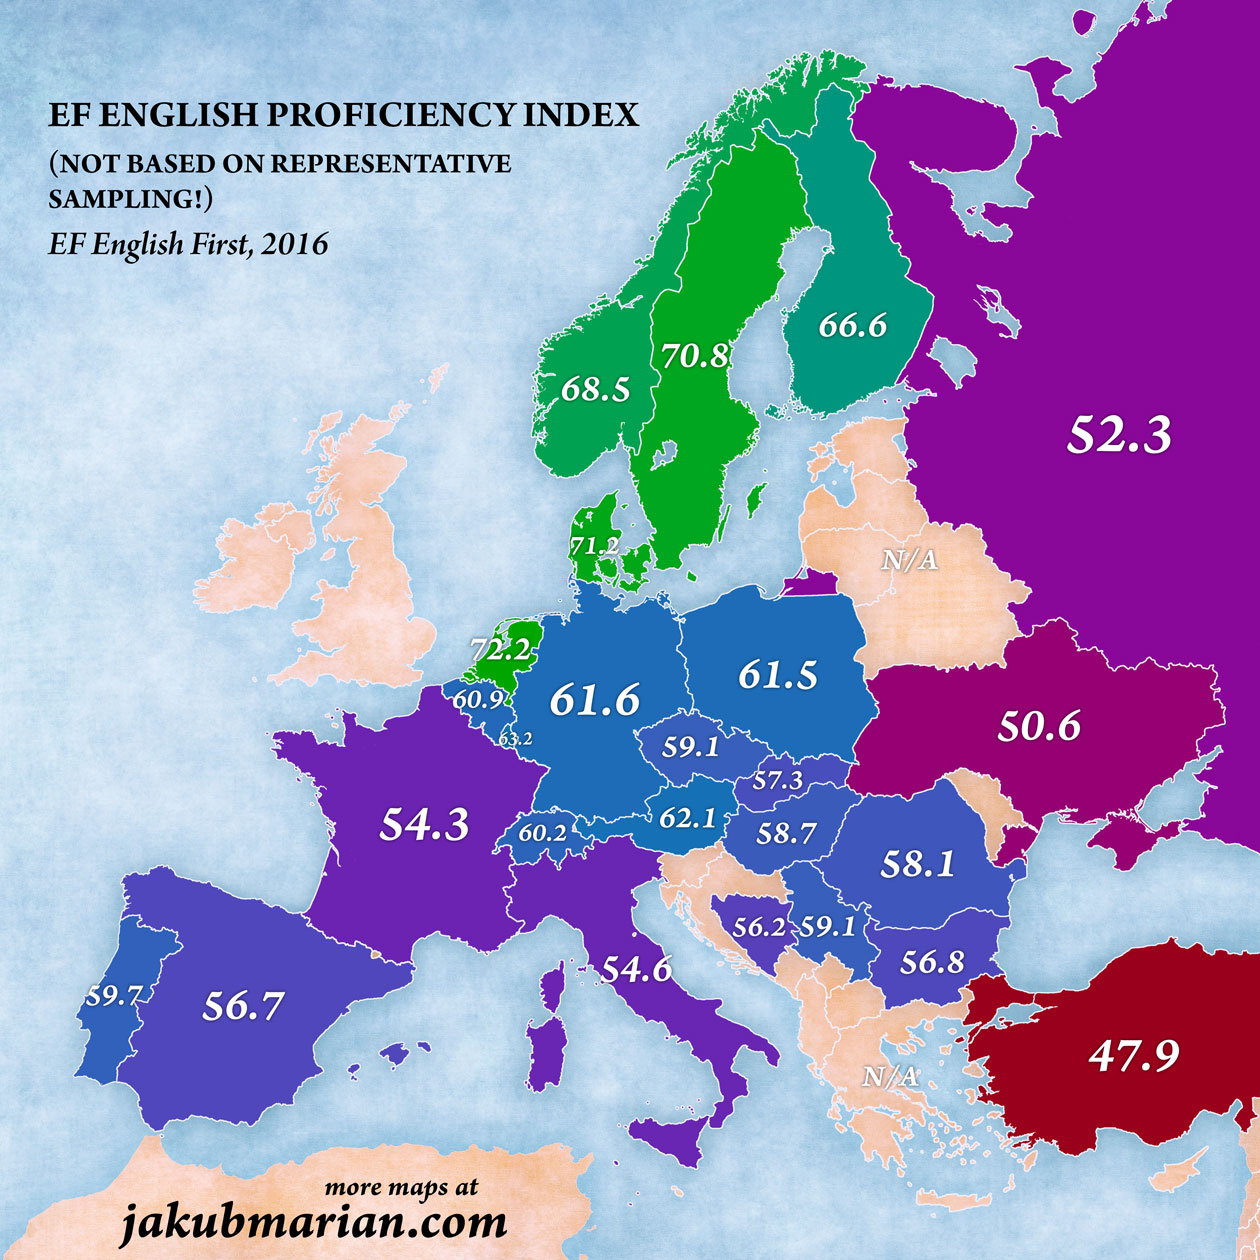
A quick glance at the map should already tell you that something is off. According to the results, Poles speak better English, on average, than the Swiss (even though Switzerland has one of the largest numbers of international companies in Europe and around 17% of the Swiss speak English at work), and Hungarians are only slightly worse than Austrians (conflicting the results of another survey, according to which more than 3.5x as many Austrians as Hungarians are even able to speak any English at all).
Please note that I don’t have anything against Poland, Hungary, Switzerland or Austria; they are just glaring examples showing that the EF EPI cannot be correct.
Methodological flaws in the EF EPI
Let’s take a look at the process used to calculate the EF EPI of a country. EF provides several online tests that anyone can take. When you take one of the tests, EF stores information about your country of residence and a few other personal details together with your score, which is represented by a number between 0 and 100. The EF EPI of a country is, essentially, the average score of all test-takers from that country during the last calendar year.
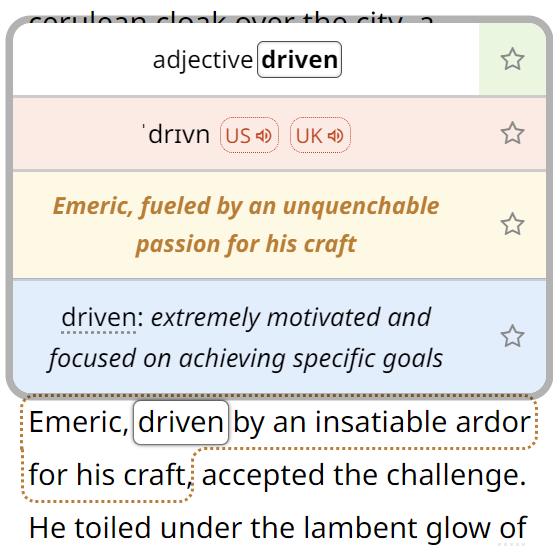
To avoid calculating the average from a small sample, EF publishes the EPI only for countries with more than 400 participants (countries with fewer than 400 participants are marked as “N/A” on the map above). While 400 would be an acceptable sample size if there weren’t any other design flaws (and there are other design flaws), it would still make differences of about ±1 attributable to random error. I therefore question the way EF presents the results on their website, an excerpt of which you can see here:

Do we really need two decimal digits here? Those two numbers may not even be statistically significantly different, and yet EF makes it look like it knows the correct values up to 4 significant digits—it even places the two countries into different categories of proficiency (Luxembourg is in the “high proficiency” category, Austria in the “moderate proficiency” category).
Sampling bias
However, all that was described above could be forgiven if there were a reason to believe that the numbers are close to what they are supposed to represent. The problem is that, considering the methodology EF uses, the figures do not mean anything because the scores are not based on representative samples.
To understand what that means, imagine what would happen if Hugo Boss, a German luxury fashion house, asked their customers to fill in a questionnaire about their standard of living. What do you think the results would be? Of course the overwhelming majority would be satisfied with their standard of living, no matter whether they ask, say, the Swiss or Indians, because people with a low standard of living simply don’t shop at Hugo Boss in either country.
Furthermore, India is a country with a large amount of income inequality, and the rich of India tend to be very rich compared to the rest of the population. Hence, the results could even be in favour of India—the 99% of poor people simply would not participate in the survey.
And this is exactly what the EF EPI does. If you struggle with basic English, you don’t suddenly think, “Oh, let’s go to an English website and take an English test.” You do that when you are already somewhat proficient in English and want to know your exact skill level.
This becomes completely clear when you imagine an extreme example of two countries, A and B, where 50% of people in country A speak good English and 50% speak excellent English, whereas 10% of people in country B speak excellent English and 90% poor English or no English at all.
Due to sampling bias, only people with excellent English in country B would take the tests, so it would have a much better EF EPI score than country A, where all people take the test, including the ones who speak “only” good English. I am entirely convinced that something like that, only in a less dramatic fashion, happens in many real-world countries during the calculation of the EF EPI.
Conclusion
EF states, on its website, that “The EF English Proficiency Index (EF EPI) is the world’s largest ranking of countries by adult English skills”. What they forget to mention is that this is only so because they are the only major company that has the nerve to falsely market the results as ranking of countries based on English proficiency.
Other organizations, such as the British Council (IELTS), ETS (TOEFL), and the University of Cambridge, could very well create similar rankings based on their own test results, and they do publish tables with average scores of participants from different countries. However, they don’t pretend that the scores are something more than that.