 |
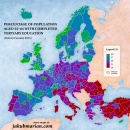
Percentage of population with completed tertiary education by region in Europe
As the job market for unqualified workforce shrinks, more and more people realize that completed secondary (high school) education no (...)
September 14, 2016 – Jakub Marian – Maps
|
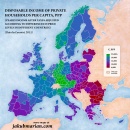 |
Disposable income (PPP) per capita by region in Europe
Disposable income is defined as income (from employment, business, property, or social security) minus taxes and social security (...)
September 12, 2016 – Jakub Marian – Maps
|
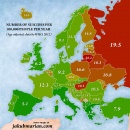 |
Suicide rates by country in Europe
People from Nordic countries have a reputation for being suicidal, but the data by WHO (World Health Organization) from 2012 show that (...)
September 8, 2016 – Jakub Marian – Maps
|
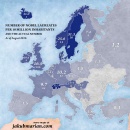 |
Number of Nobel laureates per capita in Europe (map)
The following map shows the number of Nobel laureates per 10 million inhabitants in European countries (the smaller caption shows the (...)
August 29, 2016 – Jakub Marian – Maps
|
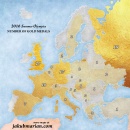 |
Number of European gold medals by country in Rio 2016
The Summer Olympic Games are over, and we will have to wait another 4 years to see Olympic athletes compete in the same sports again. In (...)
August 22, 2016 – Jakub Marian – Maps
|
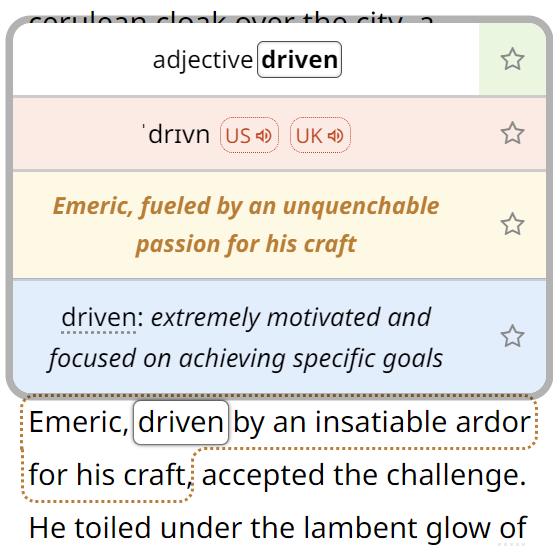
By the way, have you already seen my brand new web app for non-native speakers of English? It's based on reading texts and learning by having all meanings, pronunciations, grammar forms etc. easily accessible. It looks like this:
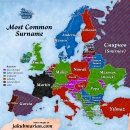 |
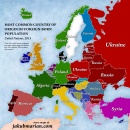
Most common surnames by country in Europe
Onomastics is a fascinating area of linguistics concerned with the study of the history and origin of proper names. Today’s map lies on (...)
July 31, 2016 – Jakub Marian – Maps
|
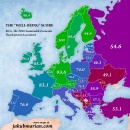 |
Best countries to live in Europe, 2016 map
It is becoming more and more clear that GDP (gross domestic product) alone is not a good indicator of a country’s performance. For (...)
July 26, 2016 – Jakub Marian – Maps
|
 |
Immigration in Europe: Map of the percentages and countries of origin of immigrants
Migration is a common phenomenon in Europe. The growth in the number of migrants has been even more pronounced after the formation of the (...)
July 18, 2016 – Jakub Marian – Maps
|
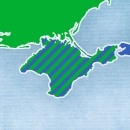 |
How I show Crimea in my statistical maps
I have been getting a lot of comments and emails lately about “errors” in my maps, all about one particular part of the map. Whenever (...)
June 23, 2016 – Jakub Marian – Maps
|
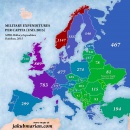 |
Military expenditures per capita and as % of GDP in Europe
The following two maps show how much European countries spent on their military in 2015, per capita and as a percentage of GDP. The maps (...)
June 21, 2016 – Jakub Marian – Maps
|